How Much Work Fits in a Sprint?
Project Commander is an add-on for Jira, not a replacement for it. It installs into your own Jira site, reads the projects, sprints, issues, people and links you already keep there, and leaves Jira as the place the work lives. The only things it stands in for are the planning and capacity features of Jira Premium and the delivery reporting of Rovo — see the side-by-side comparison.
"How many story points should we put in a sprint?" has no universal answer, and anyone who gives you a number has guessed. But your own Jira data answers it precisely, in about ten minutes. This is how to work out the right number for your team, and the four adjustments that turn it into a commitment you will actually hit.
Why there is no right number
Story points are relative. A team decides that a particular piece of work is a 3 and estimates everything else against it. That baseline is local — it is not calibrated against any other team, and it is not hours. So "how many points in a sprint" is like asking how many of somebody else's paces make a mile.
This is why the numbers you find online vary from about 10 to over 100 and all of them are useless to you. The only meaningful answer comes from your own history.
It also means points cannot be compared between teams, and a team's points changing over time can mean they got faster or that their sense of a "3" drifted. Both are worth knowing and they are not the same thing.
Finding your team's actual number
In a company-managed Scrum project, open Reports in the sidebar and choose Velocity Chart. You get one pair of bars per completed sprint: grey is everything in the sprint when it started, green is what was finished by the end, and the line across is the average completed.
Two notes before you read it. The chart is board-specific, so it only counts work matching that board's saved filter — if the team delivers work outside that filter, it is not here. And subtask estimates are excluded; only parent-level estimates count. If your team estimates at subtask level the chart is measuring something other than your work.
Take the green bars, not the grey ones. This is the whole trick, and it is where most teams go wrong. Grey is what the team promised; green is what it delivered. Planning against grey means planning to repeat a promise you have already failed to keep.
Use the last five or six sprints, and look at the spread as well as the average. Sprints of 28, 30, 31 average 30 and can be planned at 30. Sprints of 48, 30, 12 also average 30, and planning at 30 will be badly wrong about half the time. A volatile team should plan nearer the low end.
Ignore unusual sprints. The sprint that included a week of holidays, or the one where half the team was on an incident, are not evidence about a normal sprint. Leave them out of the average and be able to say why.
Four adjustments before you commit
The delivered average is a starting point, not the commitment. Four things change it, every sprint.
1. Who is actually here
The average was measured with the team you had. If two of five people are away for a week of a two-week sprint, that is roughly 20% of the sprint's capacity gone, and the number should come down accordingly. This is the largest adjustment most sprints need and the one most often skipped, because nothing in Jira subtracts it for you — capacity plans there assume a fixed 40-hour week and do not subtract holidays unless you enter them as work.
2. What is carrying over
Unfinished work from the last sprint is the first charge against this one, not an extra. If eight points carry over into a thirty-point sprint, there is room for twenty-two points of new work. Treating carry-over as a bonus is how a small deficit compounds into a permanent one.
3. What will arrive after the sprint starts
Jira's sprint report marks work added after the sprint began with an asterisk. Open your last six and count them. If an average of eight points arrives mid-sprint, you either hold the boundary or you leave eight points of room — but you do not plan as though it will not happen this time.
4. Work that is not sprint work
Support rotas, interviews, on-call, the training day. If a person spends a fifth of the sprint on something that never appears as an estimated item, their contribution is a fifth lower than the average assumes.
A worked example
A five-person team. Green bars over the last six sprints: 32, 28, 31, 30, 29, 30. Steady, average 30. One sprint of 12 six months ago, excluded — that was the week of the office move.
Now the next sprint specifically:
- One person is on holiday for the whole two weeks. Five people to four is a 20% reduction: 30 becomes 24.
- Six points are carrying over from the current sprint. Room for new work: 18.
- Scope has arrived at an average of 7 points a sprint for the last six sprints, and there is no reason this one is different. Room for planned new work: 11.
- One developer has two days of interviews. Call it another 2 points: 9.
The team's velocity is 30. The right commitment for this particular sprint is about 9 points of new work — plus the 6 carrying over and the 7 that will arrive, which is 22 points of actual delivery, close to the 24 capacity that four people represent.
A team that commits to 30 here is not being ambitious. It is committing to about three times what it has room for, and it will miss, and the miss will look like a discipline problem.
If you estimate in hours or days instead
The method is identical and the arithmetic is easier, because hours are absolute. Take each person's genuinely available hours for the sprint — not their contracted hours, but what is left after meetings, support and leave — and total them. Most teams find that a person contributes five to six hours a day of estimable work rather than eight, and that the gap is entirely ordinary rather than a sign of anything wrong.
The same four adjustments apply, in the same order.
Signs the number is still too high
- Work carries over most sprints, and the amount is growing.
- The green bar is consistently well below the grey one — you are promising more than you deliver, every sprint, by a stable margin.
- The sprint total looks fine but the same person's work is always the part that does not finish.
- Sprint planning ends with someone saying "we'll see how we go".
None of those are a reason to push harder. They are a reason to lower the number until the team hits it, and then raise it only if they keep hitting it.
Getting the number without the arithmetic
Project Commander is a Jira app that does all of the above against your live project. It works on every Jira Cloud edition, including Free and Standard.
Your delivered velocity, with its trend and its spread

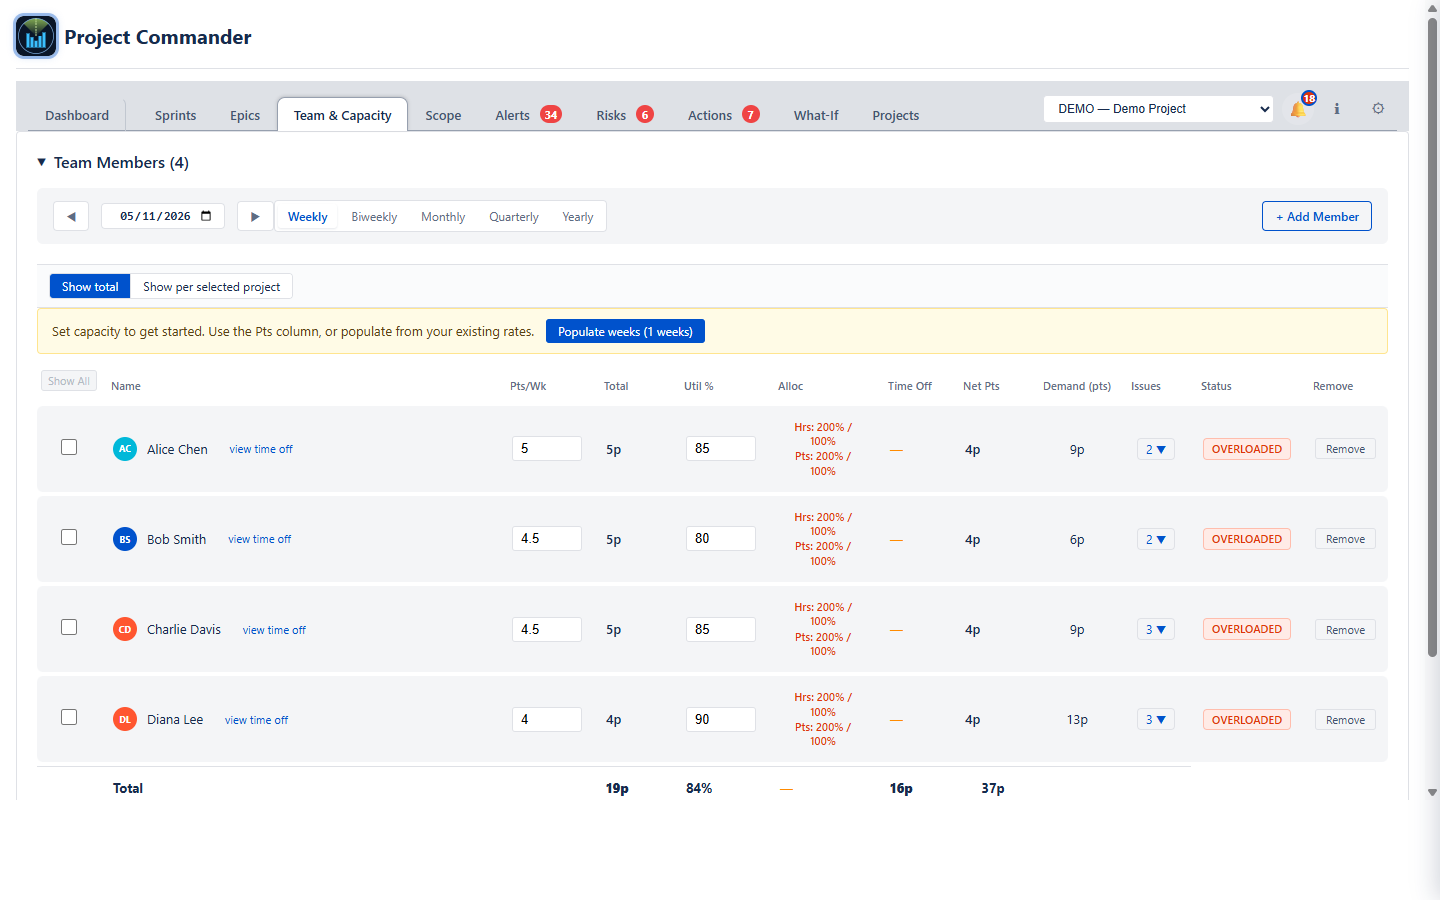
Each person's real capacity, with time off already taken out
Holidays and leave are entered once and come out of that person's capacity automatically, so adjustment one happens without anyone remembering to do it.
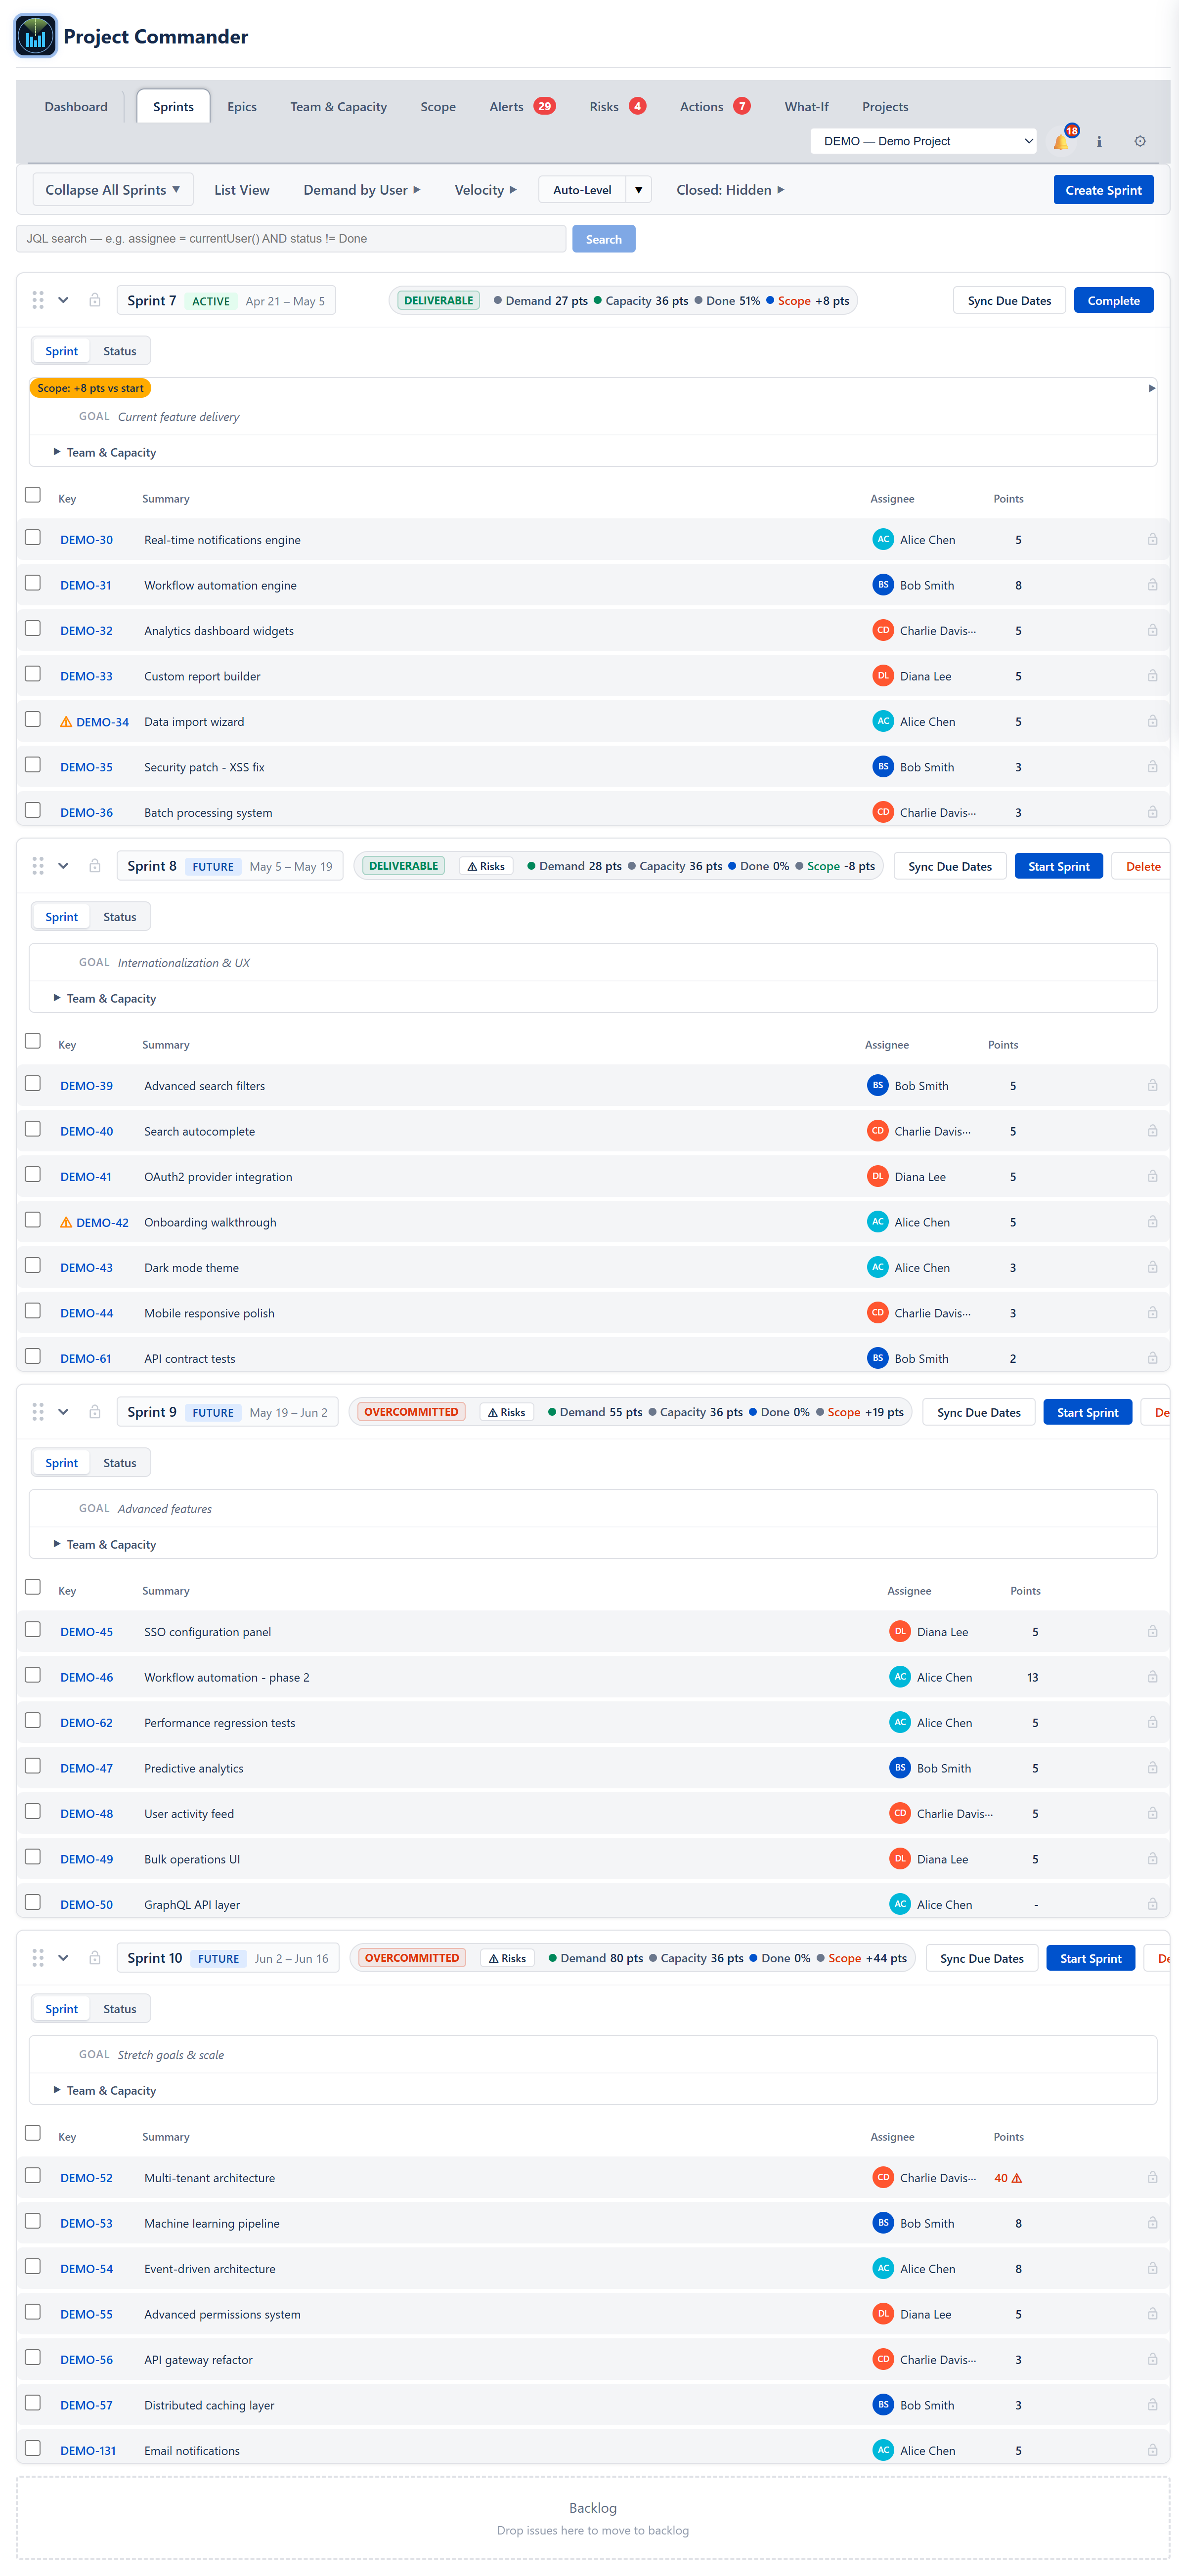
And a verdict on the sprint you are about to commit to
See what your team can actually take on
Project Commander is a free Forge app on the Atlassian Marketplace — it reads a live Jira project and works out each person’s real capacity, with time off already taken out. Or try the interactive demo first, no install needed.
Related reading: Sprint capacity planning in Jira · Jira team velocity — the full guide · All Project Commander features