How to Forecast a Jira Delivery Date You Can Actually Trust
Project Commander is an add-on for Jira, not a replacement for it. It installs into your own Jira site, reads the projects, sprints, issues, people and links you already keep there, and leaves Jira as the place the work lives. The only things it stands in for are the planning and capacity features of Jira Premium and the delivery reporting of Rovo — see the side-by-side comparison.
This is a working guide to forecasting a delivery date in Jira: what Jira gives you, why dividing the work left by your average velocity produces a date you cannot defend, and how to build one you can. Every statement about Jira here comes from Atlassian's own documentation.
Why "remaining work ÷ velocity" gives you a date you cannot defend
It is the calculation everybody does. There are 120 points left, the team does about 30 a sprint, so that is four sprints, so the date is the end of sprint four. It takes ten seconds and it feels like arithmetic.
The problem is not the sum. It is that every number in it is doing something you have not checked.
"About 30 a sprint" is an average of sprints that are not this one. It was measured when nobody was on holiday, before one of your two strongest developers handed in their notice, and when the team was not also supporting last quarter's release. Averaging across those sprints produces a number that describes a team you no longer have.
"120 points left" assumes the work stops arriving. On most projects it does not. Work added after a sprint starts is so common that Jira marks it with an asterisk in its sprint report. If scope has grown every sprint for six sprints, a forecast that assumes it stops growing today is not a forecast.
Nothing in the sum knows who is available. Four sprints of 30 points assumes four sprints at full strength. Two people away for a week inside that window and one of those sprints was never a 30.
And nothing in it knows what blocks what. If the last piece of work depends on something scheduled two sprints later, no amount of capacity finishes it on time. The arithmetic cannot see the ordering.
The result is a date that is right only if nothing changes, which is the one thing you can be sure will not hold.
What Jira gives you today
Three things, none of which is a forecast.
The velocity chart
In a company-managed Scrum project, under Reports, the velocity chart shows one pair of bars per completed sprint: grey for everything in the sprint when it started, green for what was finished by the end, with a line for the average. It is a good record of pace. It ends at the last completed sprint and says nothing about the future. Note also that it excludes subtask estimates and only counts work matching that board's filter.
The sprint report and burndown
Also under Reports, and also company-managed Scrum only. The sprint report lists what was in the sprint and marks anything added after the sprint started with an asterisk. That asterisk is the most useful and least used number in Jira — it is your scope growth, sprint by sprint, and it belongs in any forecast.
Plans, on Premium and Enterprise
Jira's advanced planning features can schedule work across future sprints and show it on a timeline, which produces dates. Two limits matter for forecasting. It is available on Jira Cloud Premium and Enterprise only. And its capacity is attached to a team rather than a person — a team's capacity for an iteration is divided evenly between the people in it — with capacity plans using a fixed 40-hour week that does not reflect your own working-day settings, and no automatic subtraction of anyone's holidays.
So the timeline will confidently place work in sprints on the assumption that everybody is present, identical, and working forty hours. The dates it produces inherit that assumption.
The four things a real forecast needs
1. What is actually left, including what keeps arriving
Start with the open work and its estimates. Then look at the last several sprints and measure how much was added after each one started. If the answer is "about eight points a sprint", the forecast has to carry that forward, because there is no reason this sprint is the one where it stops.
2. How fast this team really goes, including what it does not finish
Velocity is the first half. The second half is the gap between the grey and green bars — what the team commits to against what it delivers. A team that finishes about 80% of what it commits to should be planned at 80%. Planning at 100% builds the same 20% error into every sprint of the forecast, and the error compounds.
Trend matters more than the average. Three sprints of 38, 30, 22 average out to 30, and a forecast built on 30 will be wrong in a specific direction.
3. Who is actually available, per person, per week
This is the one that turns a plausible date into a real one. Not the team's nominal size — each person's genuine hours, with booked leave and company holidays taken out, and with the part of their week that belongs to another project removed. A sprint where two of five people are away is not a full-capacity sprint, and the forecast should know that before the sprint starts rather than after it ends.
4. What blocks what
Work that cannot start until something else finishes does not obey capacity. Two issues that block each other cannot both be first. A piece of work scheduled before the thing it depends on will not happen on the date the plan says. A forecast that ignores the ordering will always be optimistic, and always in the same way.
A worked example: the same project, two dates
A five-person team, two-week sprints, 120 points of open work, average velocity 30.
The quick answer: 120 ÷ 30 = 4 sprints = 8 weeks. Call it 28 February.
Now the four things above, applied to the same project:
- Scope has grown by an average of 9 points a sprint for the last five sprints. Over four more sprints that is roughly 36 more points. The work left is closer to 156 than 120.
- The team commits to about 42 and delivers about 30 — 71%. The 30 is right, but it is the delivered figure, so no adjustment is needed here; what is needed is not to plan at 42.
- Two people are away for a week during what would be the third sprint, so that sprint has roughly 80% of its normal capacity. Call it 24 rather than 30.
- One 13-point item late in the plan is blocked by work currently sitting two sprints after it. Until that is resequenced it cannot finish when the plan says.
156 points, at 30, 30, 24, 30 per sprint, is not four sprints. It is closer to six, and the dependency pushes the last piece further still. The defensible date is somewhere in late March, not 28 February.
The gap between those two answers is a month, and every number needed to find it was already in Jira.
Making the date defensible in front of other people
The reason this matters is not accuracy for its own sake. It is that you will be asked to justify the date, and "we divided the backlog by our velocity" does not survive the first follow-up question.
A date you can defend comes with three things attached: what it assumes, what would change it, and how confident you are. "Late March, assuming scope keeps growing at the current rate and nobody else leaves — and if we can add one person in the next fortnight, it comes back to early March" is a conversation. A single date with nothing behind it is a hostage.
Being able to answer "what would fix it" in the same breath is what turns bad news into a decision. Almost every schedule conversation that goes badly goes badly because the person delivering it can describe the problem and not the options.
How Project Commander does it
Project Commander is a Jira app that takes those four inputs from your live project and produces a date. It works on every Jira Cloud edition, including Free and Standard.
A projected finish date, against the date you promised
The forecast and the target sit side by side on the first screen, with the gap between them stated in plain words rather than left for you to work out.

Built on this team's real pace, not an average
Velocity is charted sprint by sprint with its trend, and the gap between what the team commits to and what it delivers is measured from your own sprints and applied to the plan.

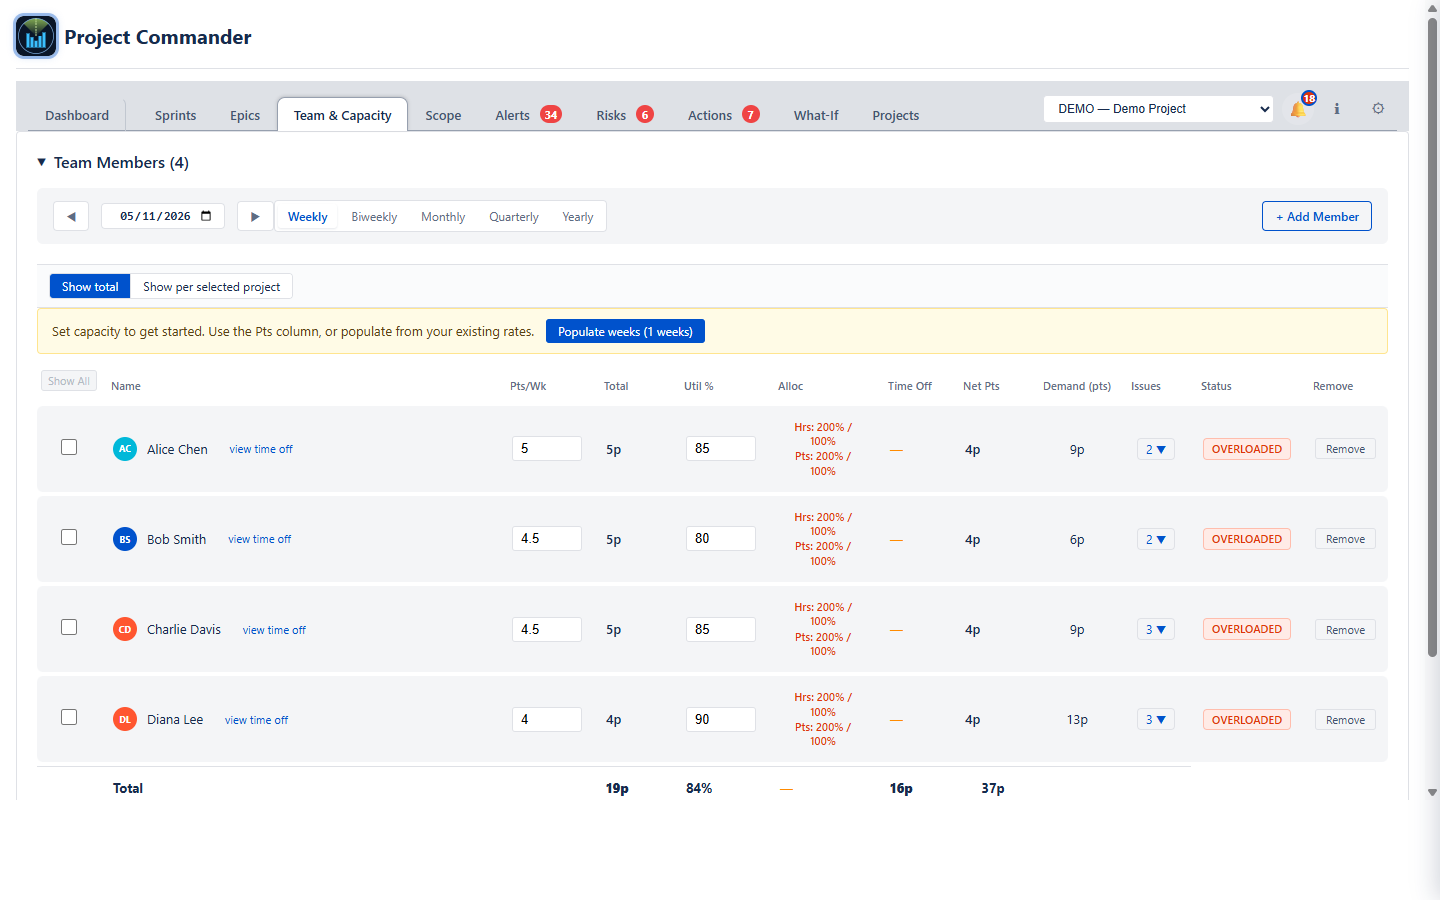
And on who is actually available
Each person's own capacity, with leave and company holidays already subtracted, rather than a team total divided by heads.
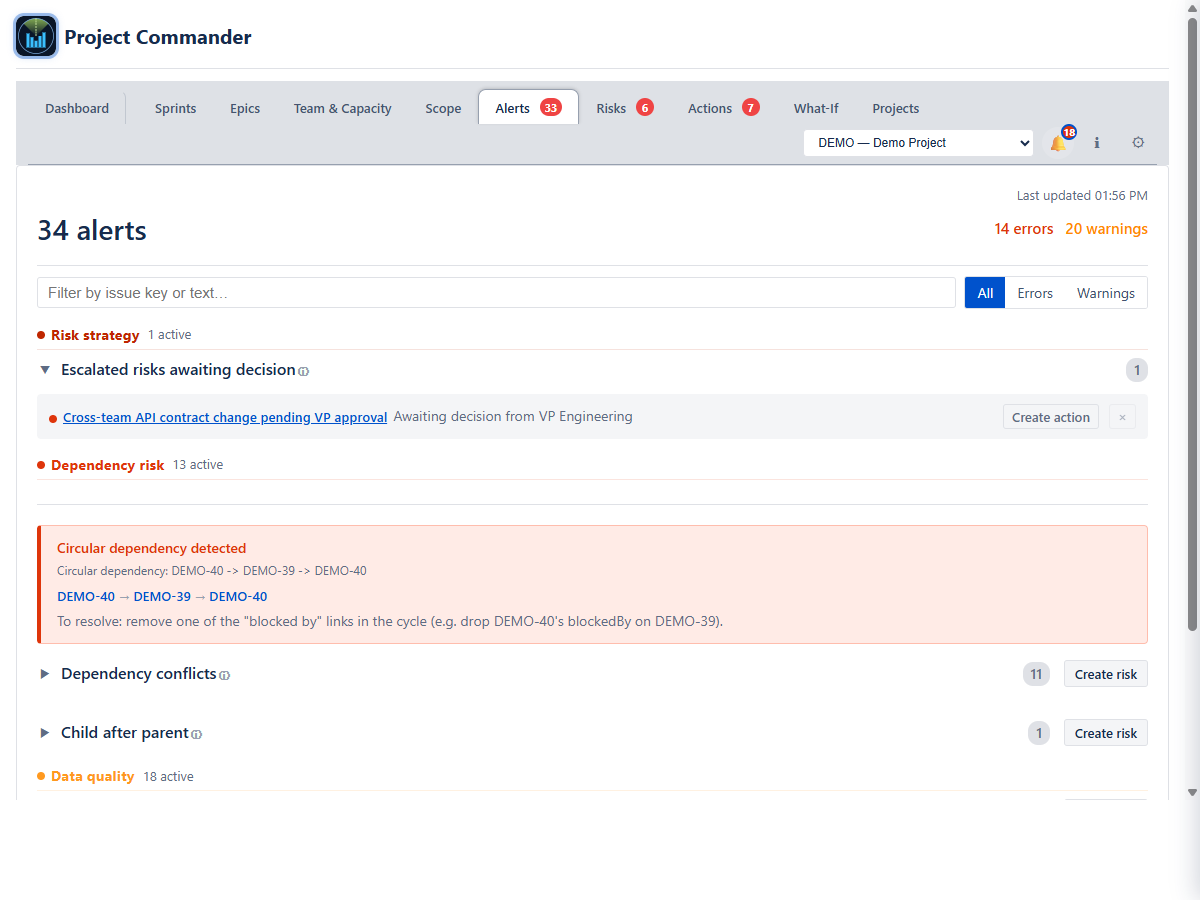
With the work that blocks other work accounted for
Dependencies are read from your issue links, so work scheduled before the thing it depends on is flagged rather than quietly assumed to be fine.
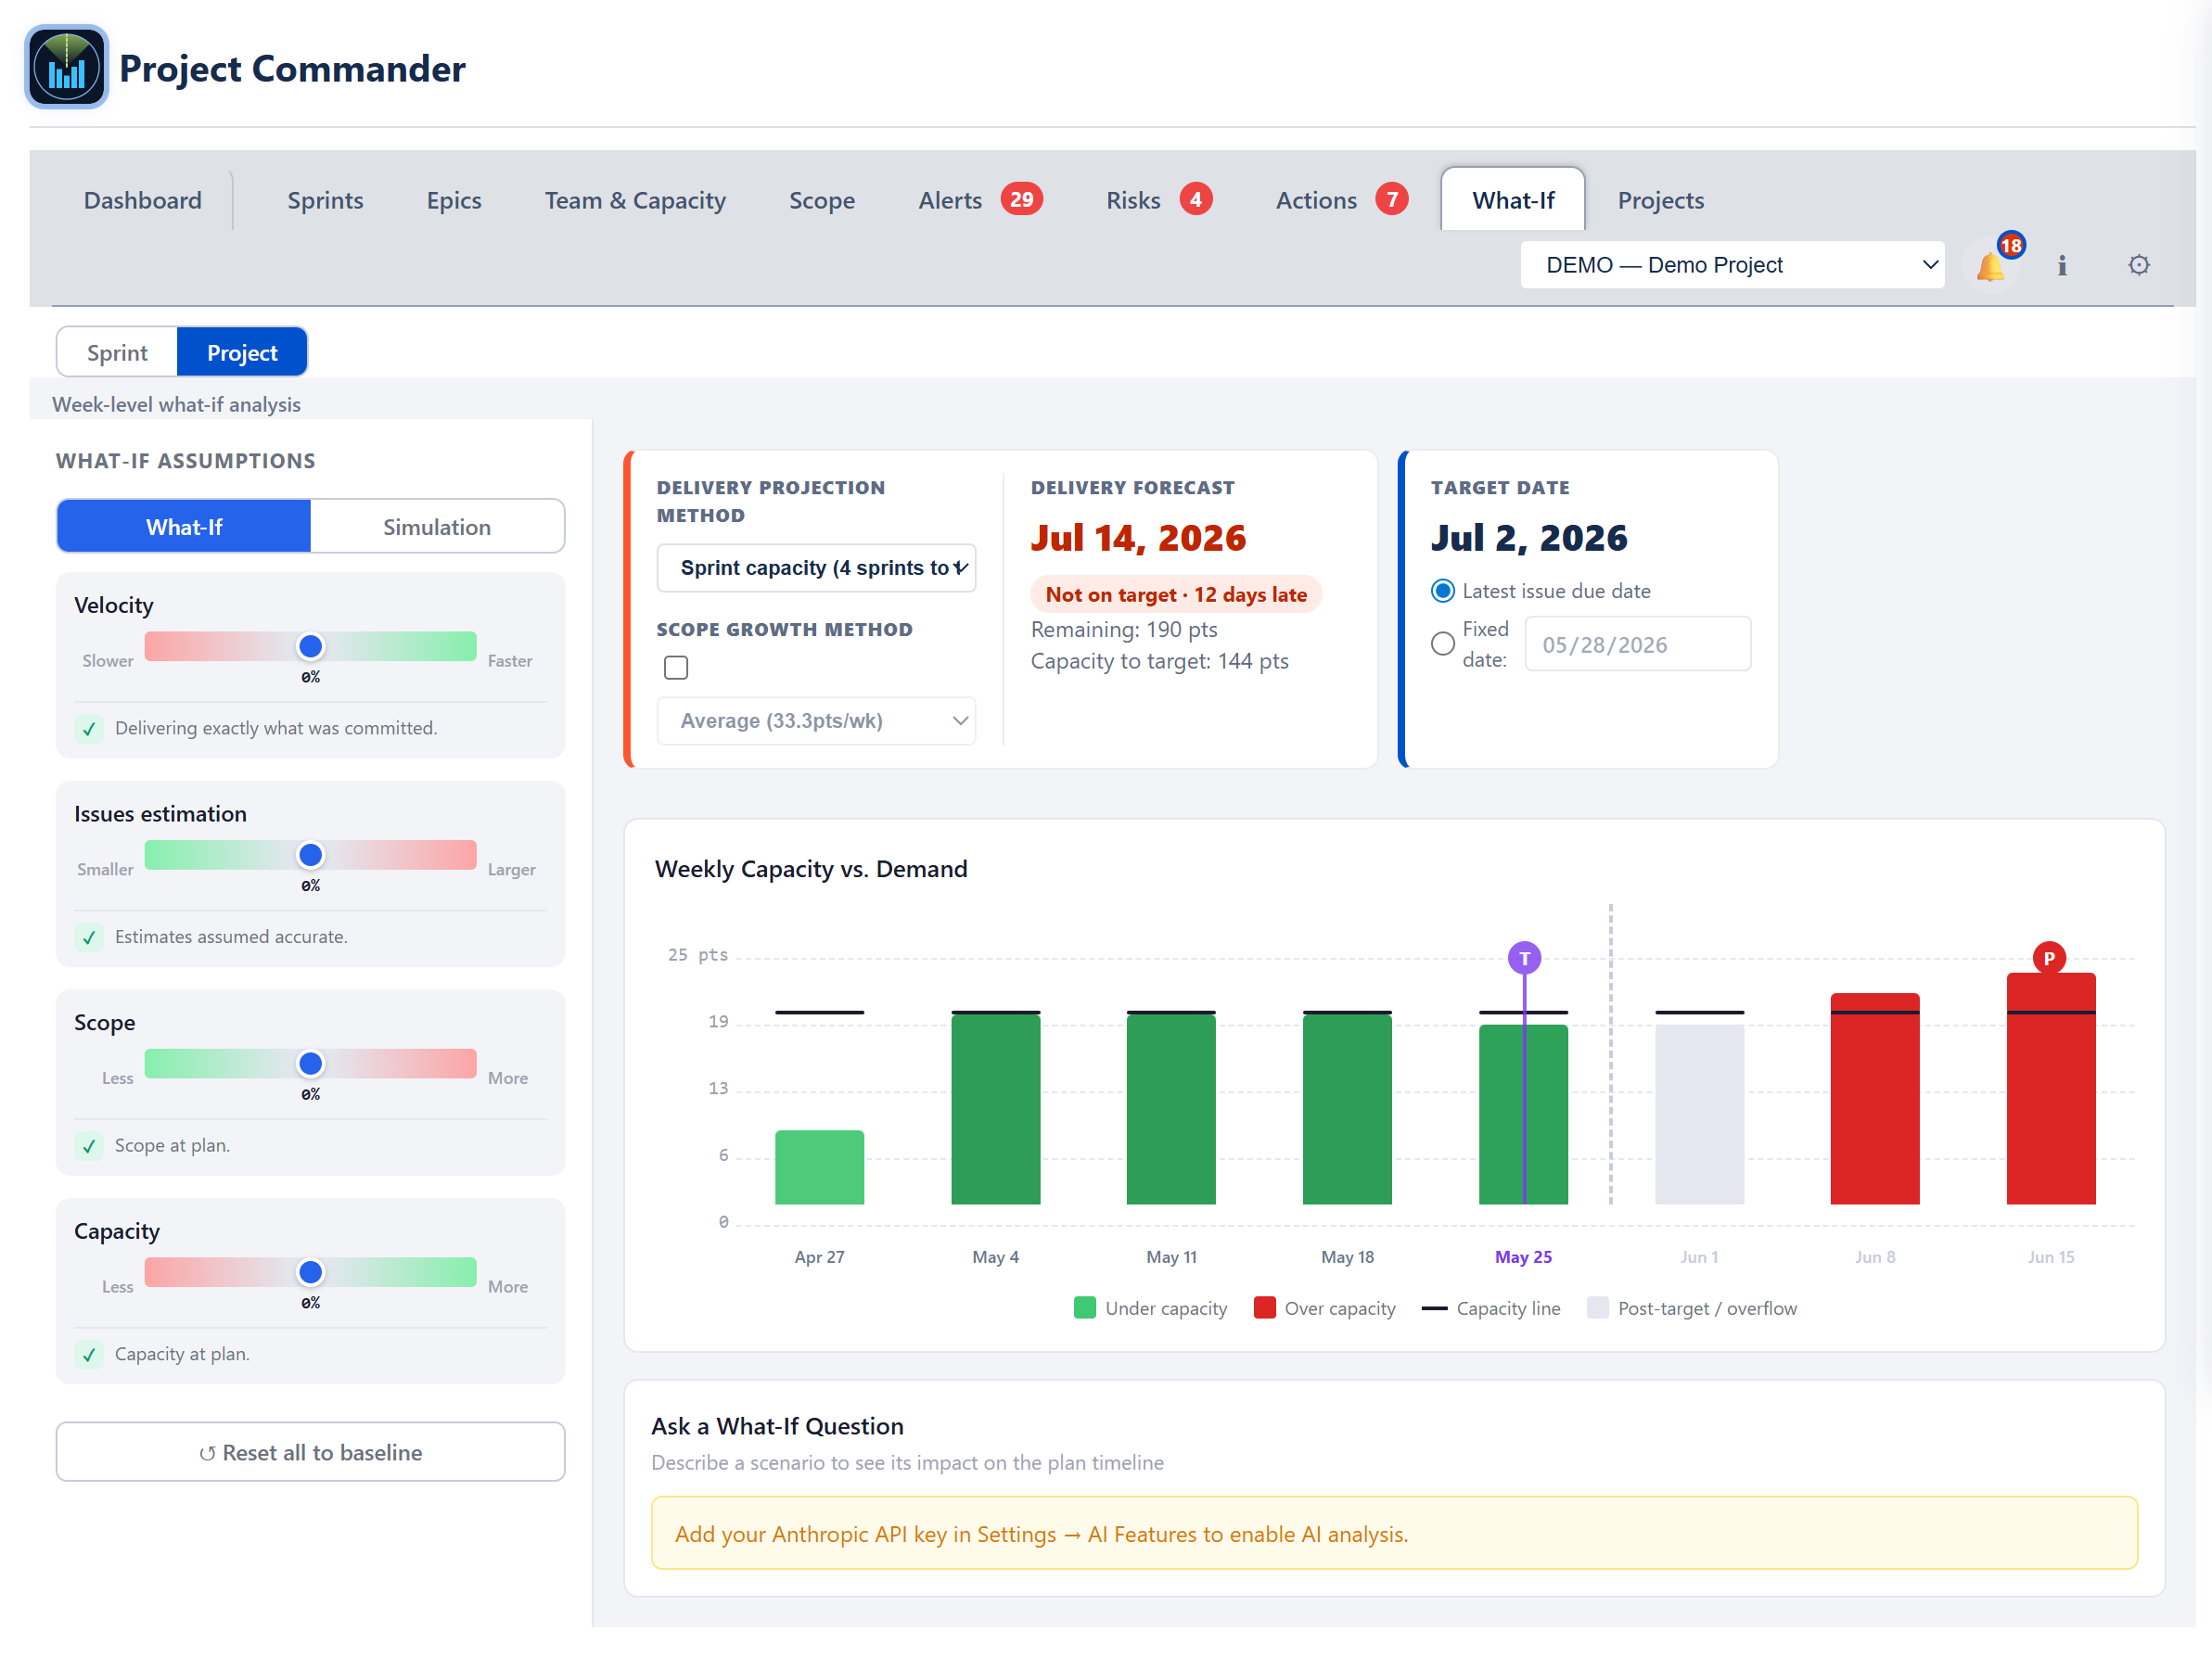
And an answer to "what would fix it"
Before committing to anything, you can try the change — another person, less scope, a later target — and see the date move.
Common questions
Does Jira forecast a delivery date?
Not in the base product. Jira's velocity chart and sprint report describe sprints that have already finished. Its planning timeline, on Premium and Enterprise, can schedule work into future sprints and so produce dates, but it does so using a team-level capacity split evenly between people, on a fixed 40-hour week, without subtracting anyone's holidays.
Can I forecast from velocity alone?
Only if the sprints ahead look like the sprints behind. Velocity cannot see holidays, someone leaving, scope that keeps arriving, or work that is blocked by other work, and each of those changes the answer.
How far ahead can a forecast be trusted?
As far as the stability of the inputs. A team with a steady velocity and stable scope can be forecast several months out. A team whose last three sprints read 38, 30, 22, with scope growing every sprint, cannot be forecast reliably beyond the next few — and the useful output there is a range and a list of what would change it.
What is the single biggest cause of a forecast being wrong?
Planning at full capacity. Using the team's nominal size, and the commitment rather than the delivery figure, builds an error into every sprint, and the error grows with every sprint you project.
See the forecast on a real project
Project Commander is a free Forge app on the Atlassian Marketplace — it installs in about two minutes and reads a live Jira project right away. Or click through the interactive demo first, no install needed.
Related reading: Jira team velocity — the full guide · Sprint capacity planning in Jira · All Project Commander features