Jira Velocity Per Person
Project Commander is an add-on for Jira, not a replacement for it. It installs into your own Jira site, reads the projects, sprints, issues, people and links you already keep there, and leaves Jira as the place the work lives. The only things it stands in for are the planning and capacity features of Jira Premium and the delivery reporting of Rovo — see the side-by-side comparison.
New — the Timeline tab. A Gantt chart nobody has to maintain: every epic and issue drawn as a bar where the forecast puts it, from the size of the work, who has it, the hours they really have, their booked time off and what blocks what. Sprints across the top, dependency arrows between the bars, the critical chain on one tick, and the same target and forecast dates as every other screen. See what it does →
This page answers one question: how much is each person actually finishing, sprint by sprint? Not how fast the team is — that is the team velocity guide. This is the split underneath it: velocity by team member, per developer, per user, whatever your team calls it.
Why the split changes decisions
A team velocity of 30 can be five people delivering six each. It can also be two people delivering thirteen each while a third is blocked every sprint. Jira's chart shows those two teams identically, and they are not remotely the same team.
The difference only becomes visible when something moves:
- Somebody leaves. In the first team you lose a fifth of the output. In the second, if it is one of the two, you lose closer to half — and the plan built on 30 was never real.
- Somebody takes two weeks off. Same arithmetic, temporarily.
- You add a person. If two people are carrying the sprint, a sixth pair of hands does not add a sixth of the velocity. It adds whatever the bottleneck lets it add.
- One person quietly stops delivering. Their sprints go 8, 5, 2 while the team total holds at 30 because someone else absorbed it. Nothing on the chart moves until the person absorbing it runs out.
Every one of those is a planning decision, and the team average is silent on all of them.
What Jira gives you, and what it does not
Jira has a velocity chart built in. It is on company-managed Scrum projects only — team-managed projects and Kanban boards do not have it — and you reach it through Reports in the project sidebar.
What it shows: one grey bar per completed sprint for what the team committed to, one green bar for what it finished, and an average line across the sprints shown. What it shows per person: nothing. There is no assignee filter on the chart, no per-person view, and no edition of Jira Cloud that adds one.
Three more limits worth knowing before you try to work around it, all of them stated in Atlassian's own documentation:
- Estimates on subtasks are excluded — only parent-level estimates count. If your team estimates at subtask level, the chart is measuring something other than the work you did.
- The chart is tied to one board and its saved filter. Work the person delivered outside that filter did not happen, as far as the chart is concerned.
- The y-axis follows the board's estimation setting, so the unit is whatever that board is set to.
The three workarounds, and how each one breaks
1. A search per person, per sprint
Search for one person's completed issues in one sprint, add up the estimates, write the number down, repeat for the next person and the next sprint. It works, once. It is a grid of searches every fortnight, done by hand, and the moment anyone stops doing it the history stops.
It is also quietly wrong in one way people rarely notice: it counts what a person finished, with nothing to compare it against. A person who finished 8 points looks the same whether they started the sprint carrying 8 or carrying 25.
2. Export the issues and total them in a spreadsheet
Faster to do once, and it survives about as long. The export is a snapshot: it does not know what the sprint looked like on day one, so work added mid-sprint and work pulled out again both land in the same column. Re-run it a month later and the numbers for sprints you already reported will have changed underneath you.
3. Count issues instead of estimates
Counting how many items each person closed avoids the estimation problem entirely, which is why it is tempting. It replaces it with a worse one: a person who closes eight small items and a person who closes one large one look eight to one. On any team where the work is not uniform, this measures the size of the pieces, not the amount of work done.
What per-person velocity should actually mean
One number per person is not enough. The useful reading has three parts, per person, per sprint:
- What they were carrying at the start — the work assigned to them when the sprint began.
- What they finished by the end — and, separately, what they did not.
- The ratio between the two, tracked over several sprints.
That third part is where the information is. Somebody who is consistently given 20 and finishes 10 is not slow — they are consistently over-committed, which is a planning fault, not a person fault. Somebody who is given 10 and finishes 10 every sprint is the most predictable person on the team, whatever their absolute number looks like next to anyone else's.
And the concentration matters as much as any individual line. If two people out of five account for two thirds of what gets finished, that is the single most important fact about the team's plan, and it is the fact the team average is designed to hide.
The line you should not cross
Per-person velocity is a planning number. It is not a performance measure, and the moment it is used as one it stops being either.
Estimates are a shared guess about the size of a piece of work. They are not a measure of effort, they are not comparable between people, and they get worse the instant anyone realises their number is being watched. A team that suspects its estimates are being scored will inflate them, and then nothing on any chart means anything ever again.
The safe uses are narrow and they are the useful ones anyway: compare a person against their own previous sprints, not against a colleague; look at how concentrated the delivery is across the team; look at who is repeatedly given more than they can finish. None of those require ranking anybody.
Seeing it in Project Commander
Project Commander is a Jira app that reads your sprint history and does the split for you. It works on every Jira Cloud edition, including Free and Standard, and on team-managed projects, which have no velocity chart of their own. It needs completed sprints to read, so it answers this question for teams that run sprints.
Filter the sprint history to one person
On the Sprints tab, open Velocity. Above the sprint history table there is a row marked Filter, with an All button and one button for each person on the team.
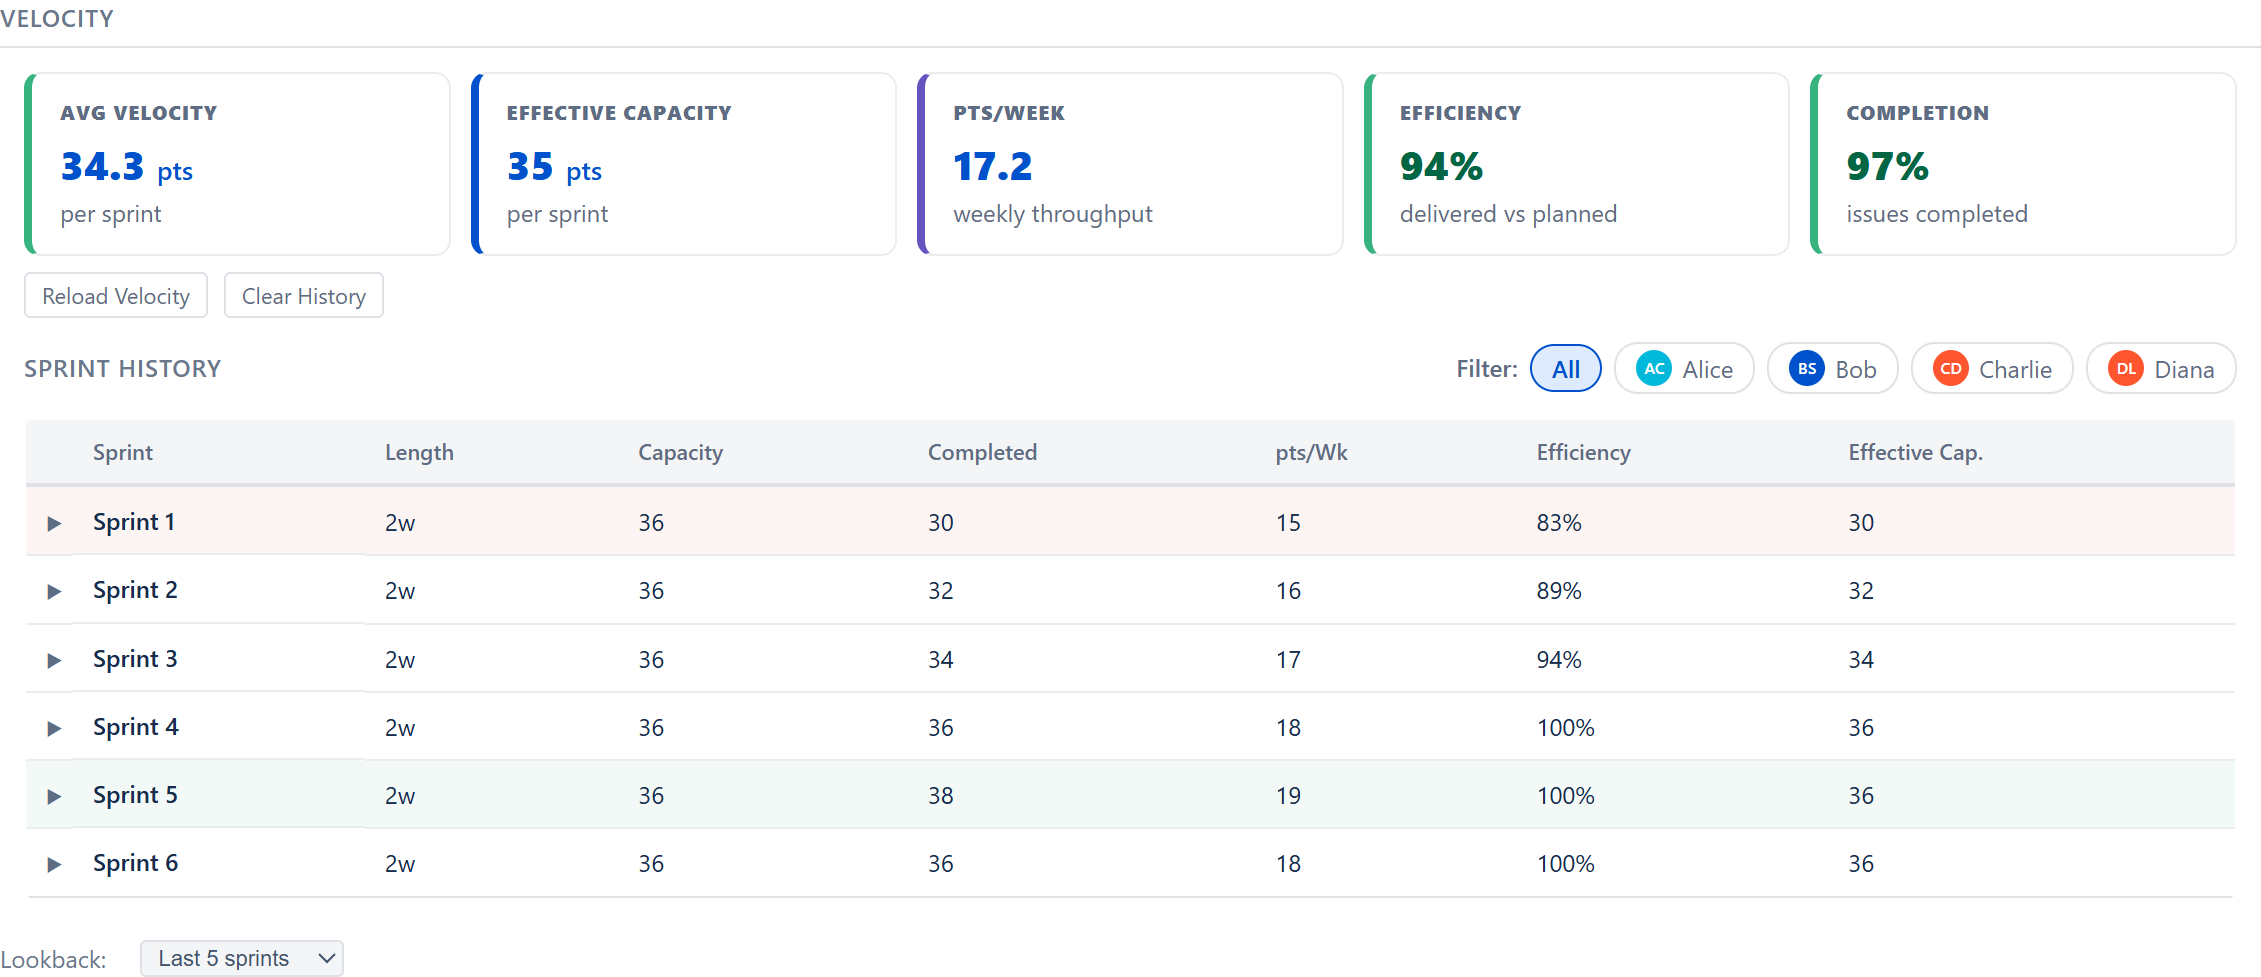
Click a person and every row in the table switches to their numbers instead of the team's:
- Capacity — what that person was planned to carry in that sprint.
- Completed — what they actually finished by the end of it.
- Per week — their completed work divided by the number of calendar weeks in that sprint, so sprints of different lengths can be compared with each other.
- Efficiency — their completed work as a percentage of what they were planned to carry. This is the ratio that matters, and it is the one no manual workaround produces.
Select several people and the table adds them together, which is how you check whether two people really do account for most of the output.
Open a sprint and see the issues behind the number
Expanding any sprint row lists the individual issues, each with the person it was assigned to and a marker showing whether it was completed, not completed, or removed from the sprint. So a per-person number is never a figure you have to take on trust — the work behind it is one click away.
And who is carrying the work that is still ahead
Velocity is the past. The other half of the question is who is loaded up right now. On the same Sprints tab, Demand by User lists each person with the work still assigned to them — the amount and the number of issues — so the person who has historically finished the most and the person carrying the most right now are rarely the same name.

Set against what each person is actually available for
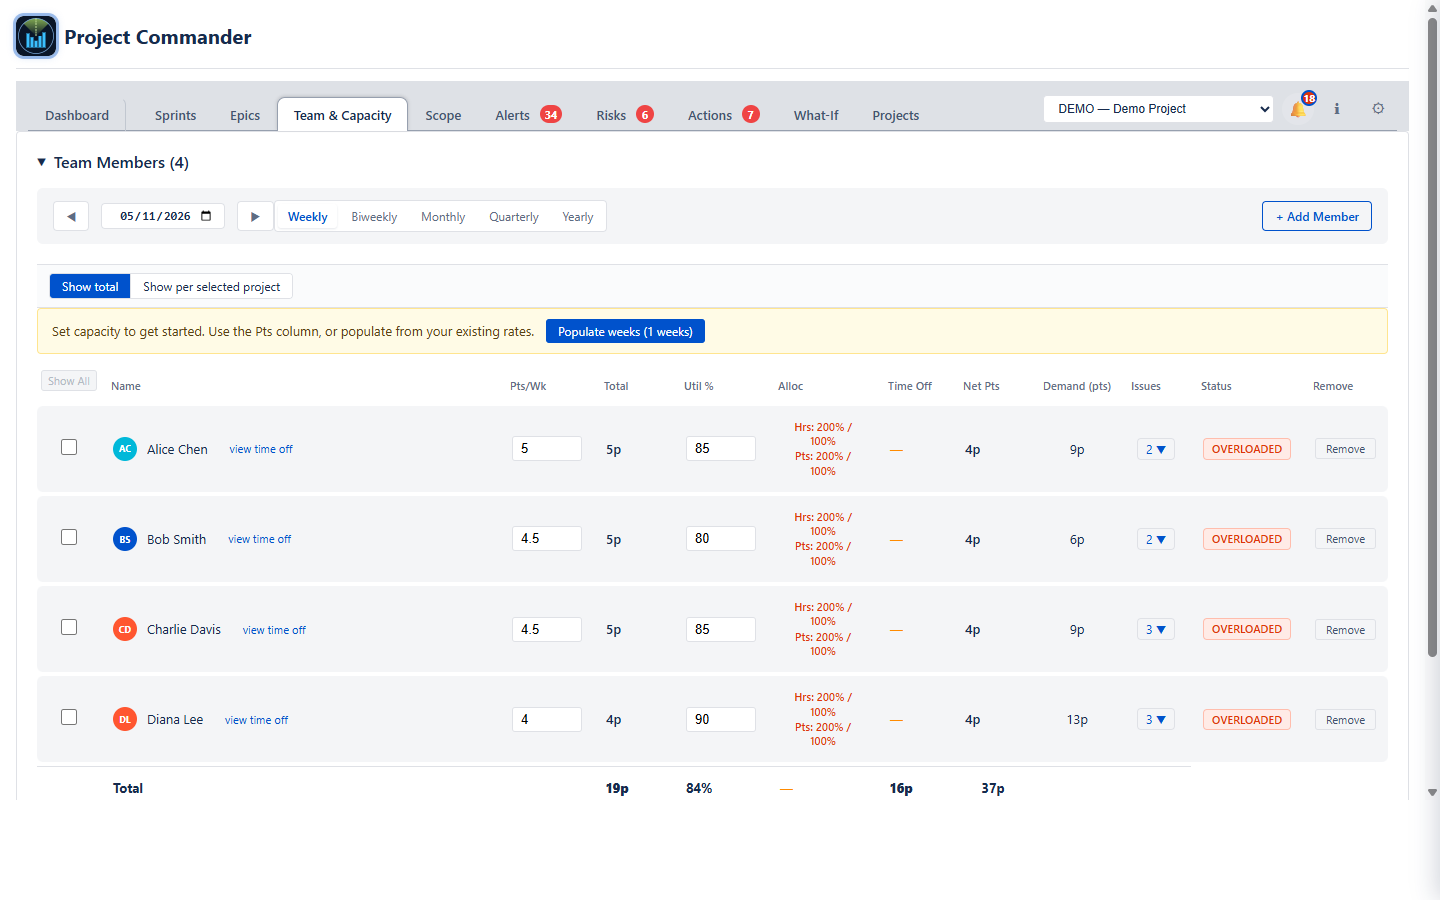
Delivered work only means something next to the time the person had. Each person's real capacity — their own hours, with holidays and leave already subtracted — sits alongside the work assigned to them, so someone who looks slow because they are half-time on another project reads as half-time rather than as slow. That half has its own guide: sprint capacity planning in Jira.
Common questions
Can Jira show velocity per person?
No. The velocity chart is a single pair of bars per sprint for a whole board. There is no built-in report for velocity by team member, per developer or per user, on any edition.
Why not just filter the velocity chart by assignee?
The chart has no assignee filter. It reads the board's saved filter, and changing that changes the board for everyone who uses it — and still produces one combined number rather than a split.
Is per-person velocity a measure of how good someone is?
No, and using it that way breaks it. Estimates are a shared guess about size, not a measure of effort, and they are not comparable between people. Compare a person against their own previous sprints, never against a colleague.
What if we estimate in hours rather than story points?
It works the same. The question always reduces to what a person was carrying at the start against what they finished by the end. Only the unit changes.
What about several teams, or one person across several boards?
Jira's chart is tied to one board, so a person who delivers across two boards has two partial pictures and no whole one. Project Commander reads a board too, so the same boundary applies — but you register each project separately and get the per-person split within each, and the Projects view puts every registered project side by side. There is no single combined per-person figure spanning projects today.
Do I need Jira Premium?
No. Jira does not offer per-person velocity on any edition, Premium included. Project Commander adds it and runs on Free and Standard as well, and on team-managed projects, which have no velocity chart of their own.
See who is actually delivering
Project Commander is a free Forge app on the Atlassian Marketplace — it reads a live Jira project and splits your velocity by person, sprint by sprint, alongside each person's real capacity. Or try the interactive demo first, no install needed.
Related reading: Jira team velocity — the full guide · Sprint capacity planning in Jira · All Project Commander features