 Project Commander Docs
← Back to site
Project Commander Docs
← Back to site
Projects Tab — Feature Guide
What it's for
The Projects tab is the programme view: every project the team is running side-by-side, plus the team allocation matrix that splits people across them, the cross-project dependency declarations that propagate slips between them, and the cross-project Critical Chain that finds the longest constrained path across the portfolio.
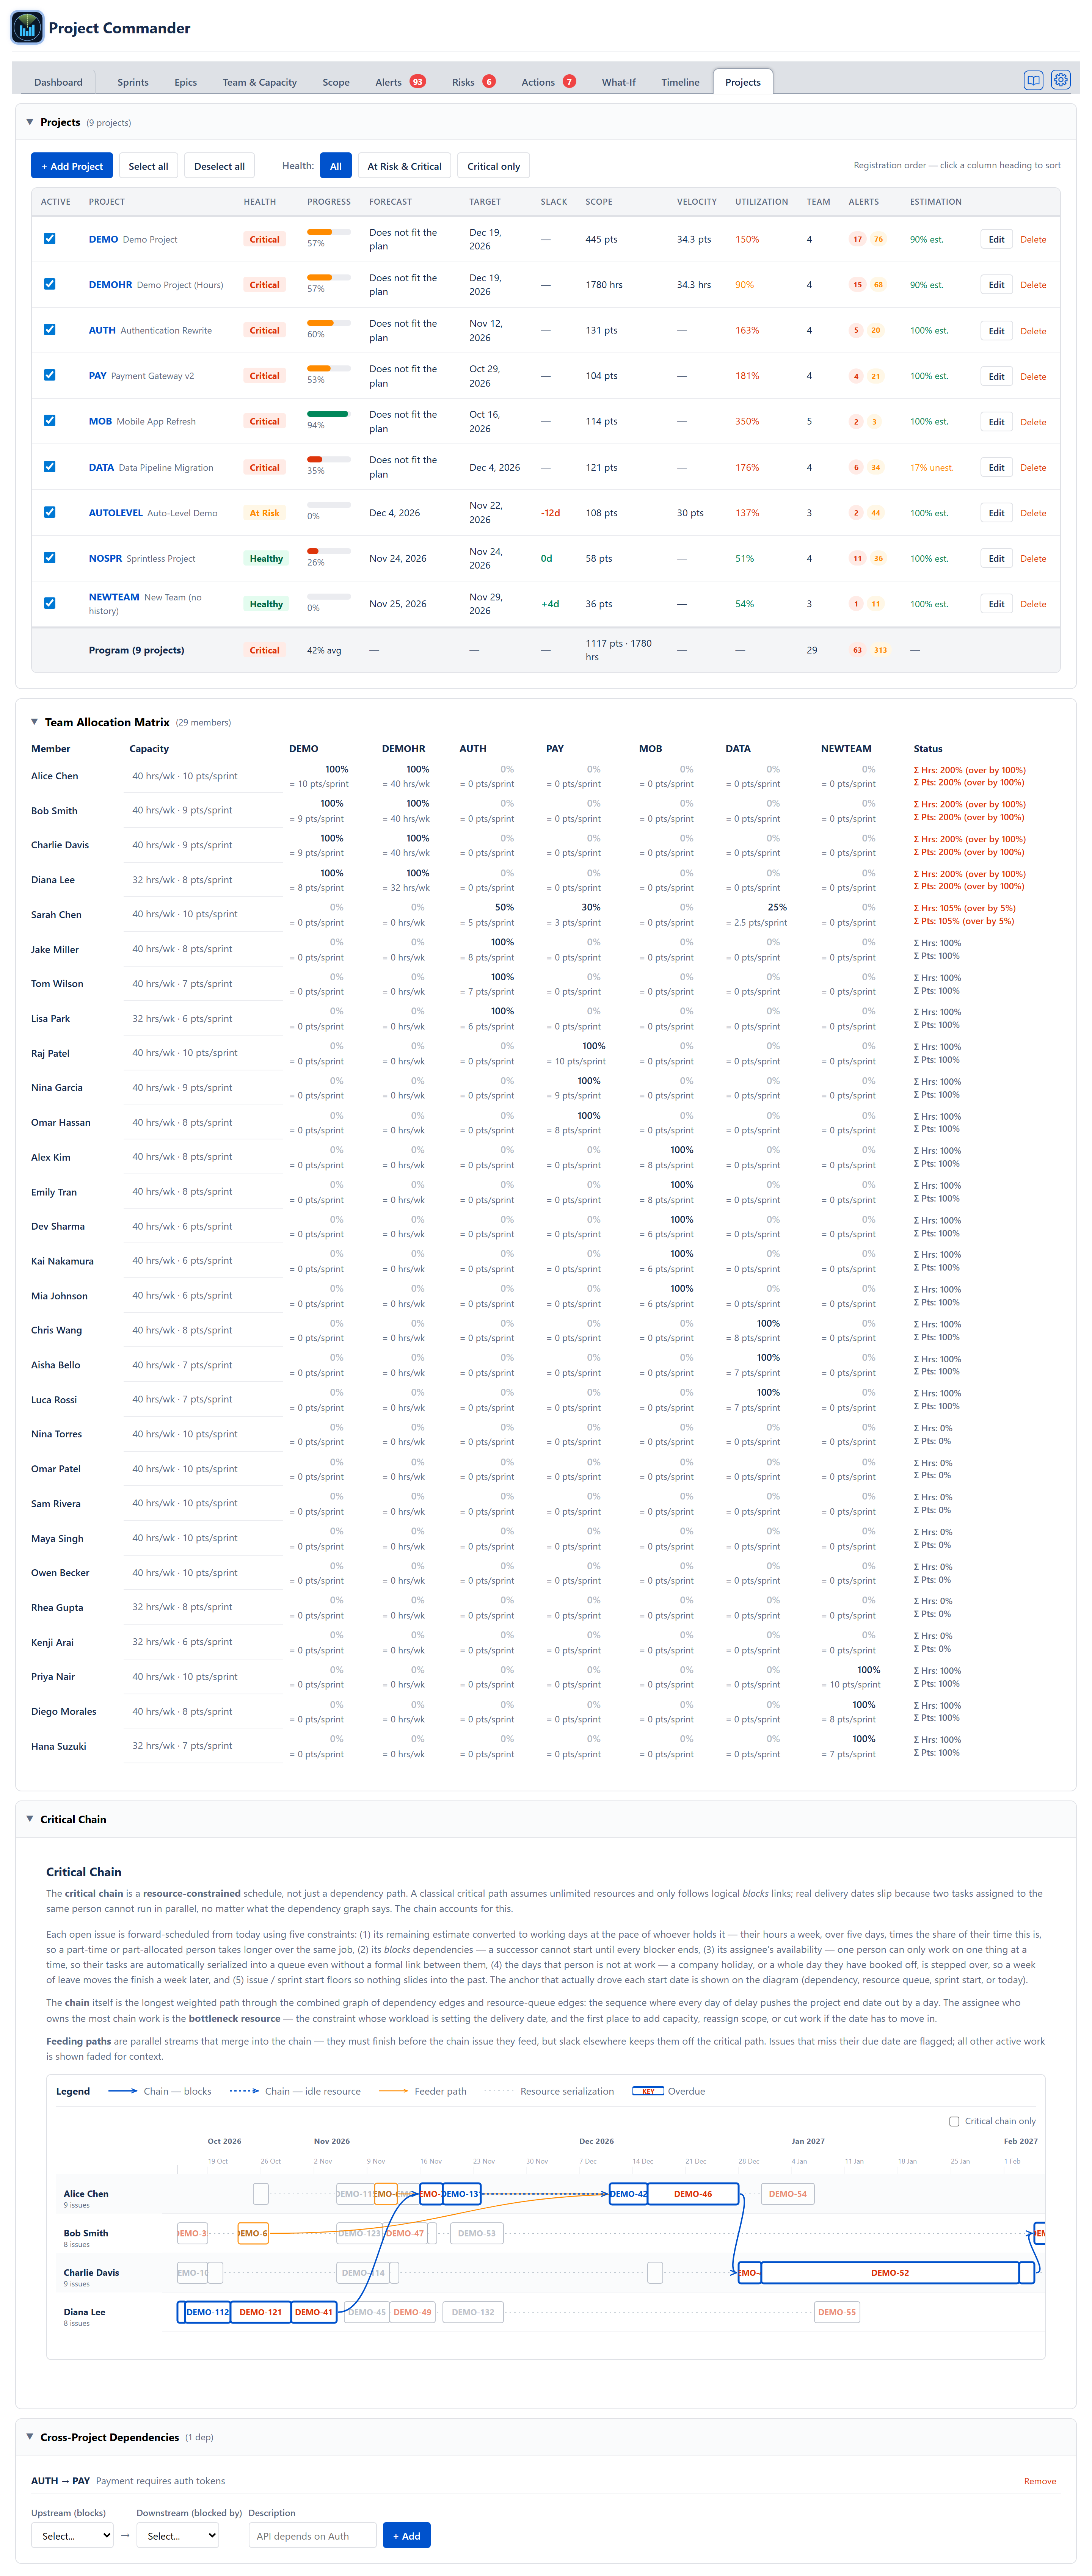
The tab is four folding sections, top to bottom: Projects (the portfolio table, open when the tab opens), Team Allocation Matrix, Critical Chain and Cross-Project Dependencies (all three closed when the tab opens; click a heading to open it).
Four things live in one tab: register a new project, edit per-project settings, see a read-only portfolio dashboard with per-project health, and declare and watch cross-project blocking dependencies. The portfolio table is a monitoring view — it reports each project's forecast, slack, utilization, and alerts and does not edit them inline. To model "what if" changes across the portfolio (adding people, scope growth, a slowdown), use the What-If tab's All Projects view, where sliders and a Monte Carlo simulation update the whole-program forecast and odds.
The audience is programme managers, portfolio leads, and engineering directors. A single project's view is on the Dashboard; this is where multiple projects meet.
In the web app at projectcommander.app/app, demo mode runs this tab on sample data (a project added there cannot load real work, and everything resets on reload), while Connect Your Own Jira registers real projects read-only. Connected with an API token, the list of registered projects is kept on your Jira account, so it follows you to another browser; connected through Atlassian's sign-in, it is kept in that browser only. The app installed in your Jira site from the Atlassian Marketplace keeps it in the app's own storage on your site, against your Atlassian account.
Programme model
A programme is a set of related projects plus a shared team and the allocations between them. Each programme contains:
- Projects — registered with a JQL filter that defines membership, plus a Jira board ID when the project runs sprints.
- Team members — pool of people with base capacity (hours per week, points per sprint) drawn from the Team & Capacity tab.
- Allocations — per (member × project) entries stored as a percent of capacity. The entry is kept in both units — a percent of the member's hours a week and a percent of their points a sprint — so switching a project between points and time loses nothing, but it is ONE share of one person: when the unit the project counts in carries no share, the share stored in the other unit is used (7 October 2026). The percent is the source of truth and survives capacity changes without rebalancing; the matching absolute "= X" is recomputed from it and labelled with its period (pts/sprint for points, hrs/wk for hours).
- Dependencies — declarative project A blocks project B statements.
Toolbar / header
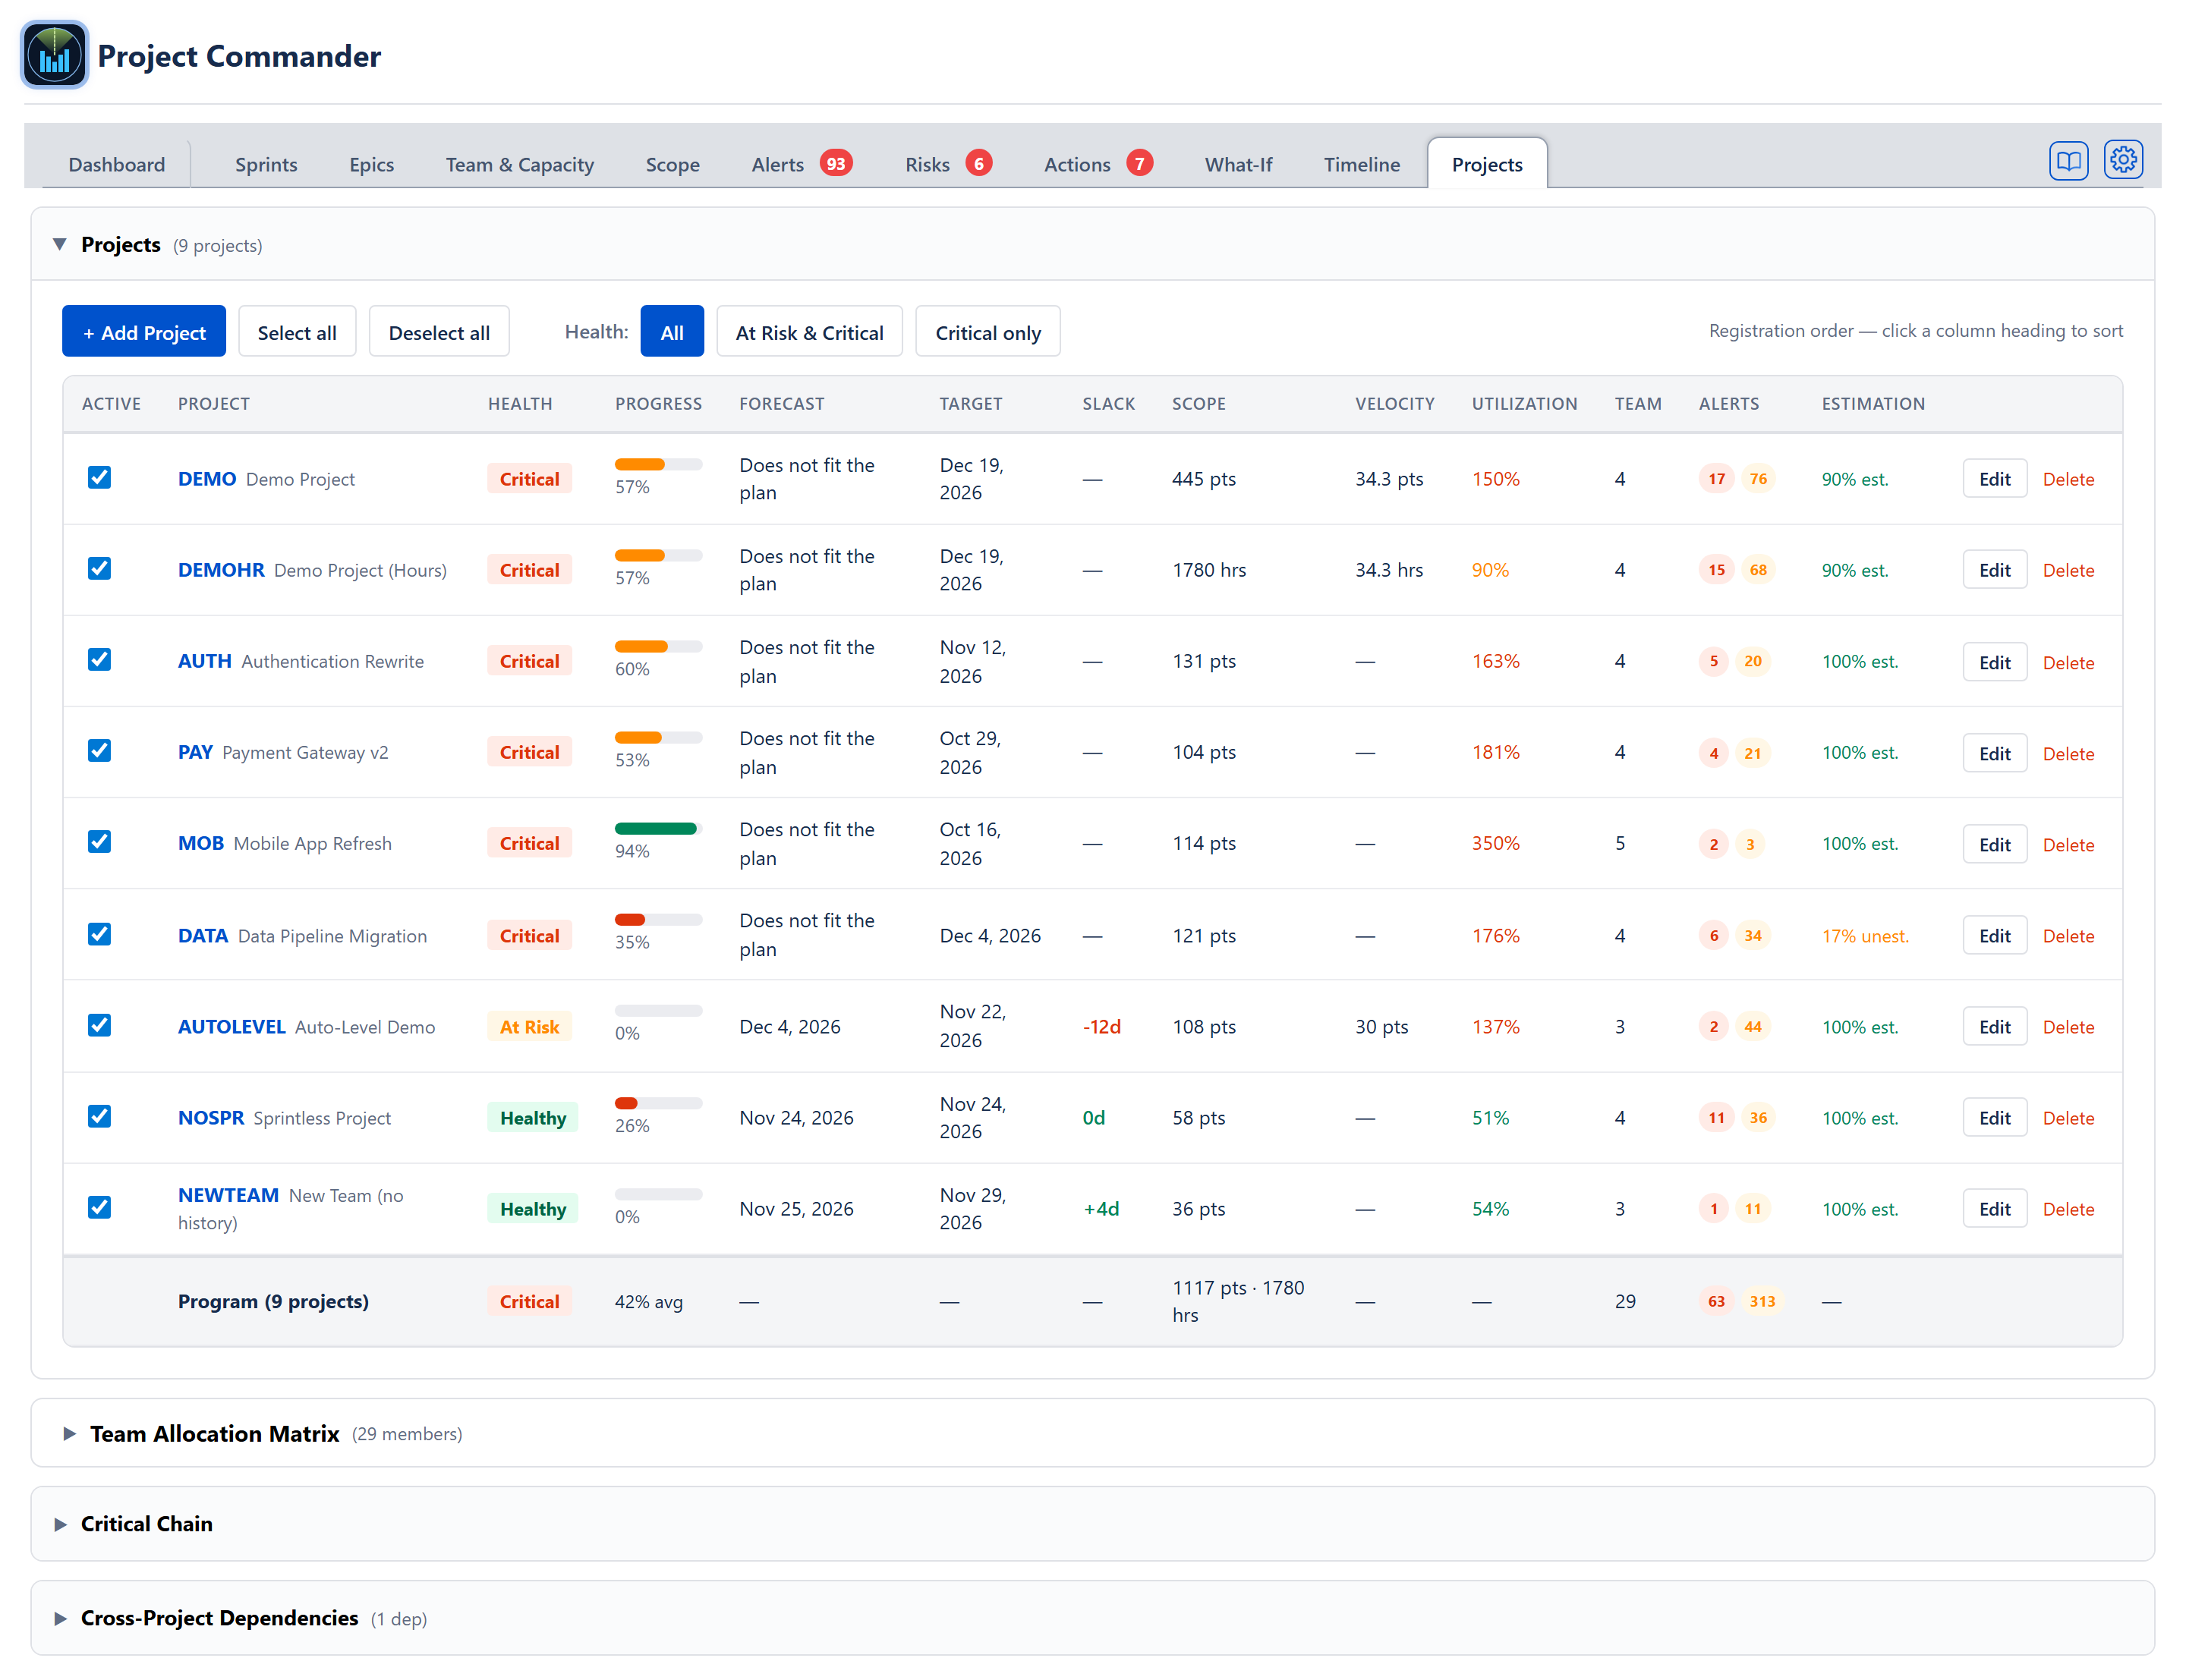
The tab's table sits inside a folding section headed Projects, carrying the count (9 projects, or 7 of 9 projects active when some are unticked). Its controls run along one row:
- + Add Project — opens the project registration form. Hidden while the Add form is open.
- Select all / Deselect all — tick or untick every project's Active checkbox (see below) in one click. Shown only when at least one project is registered.
- The word Health: followed by the three health filter buttons (see Filtering by health below). Shown only when at least one project is registered.
- A note at the end of the row saying how the table is currently ordered: Registration order — click a column heading to sort, or Sorted by <column> — click a column heading to re-sort once a column has been picked.
Add Project form
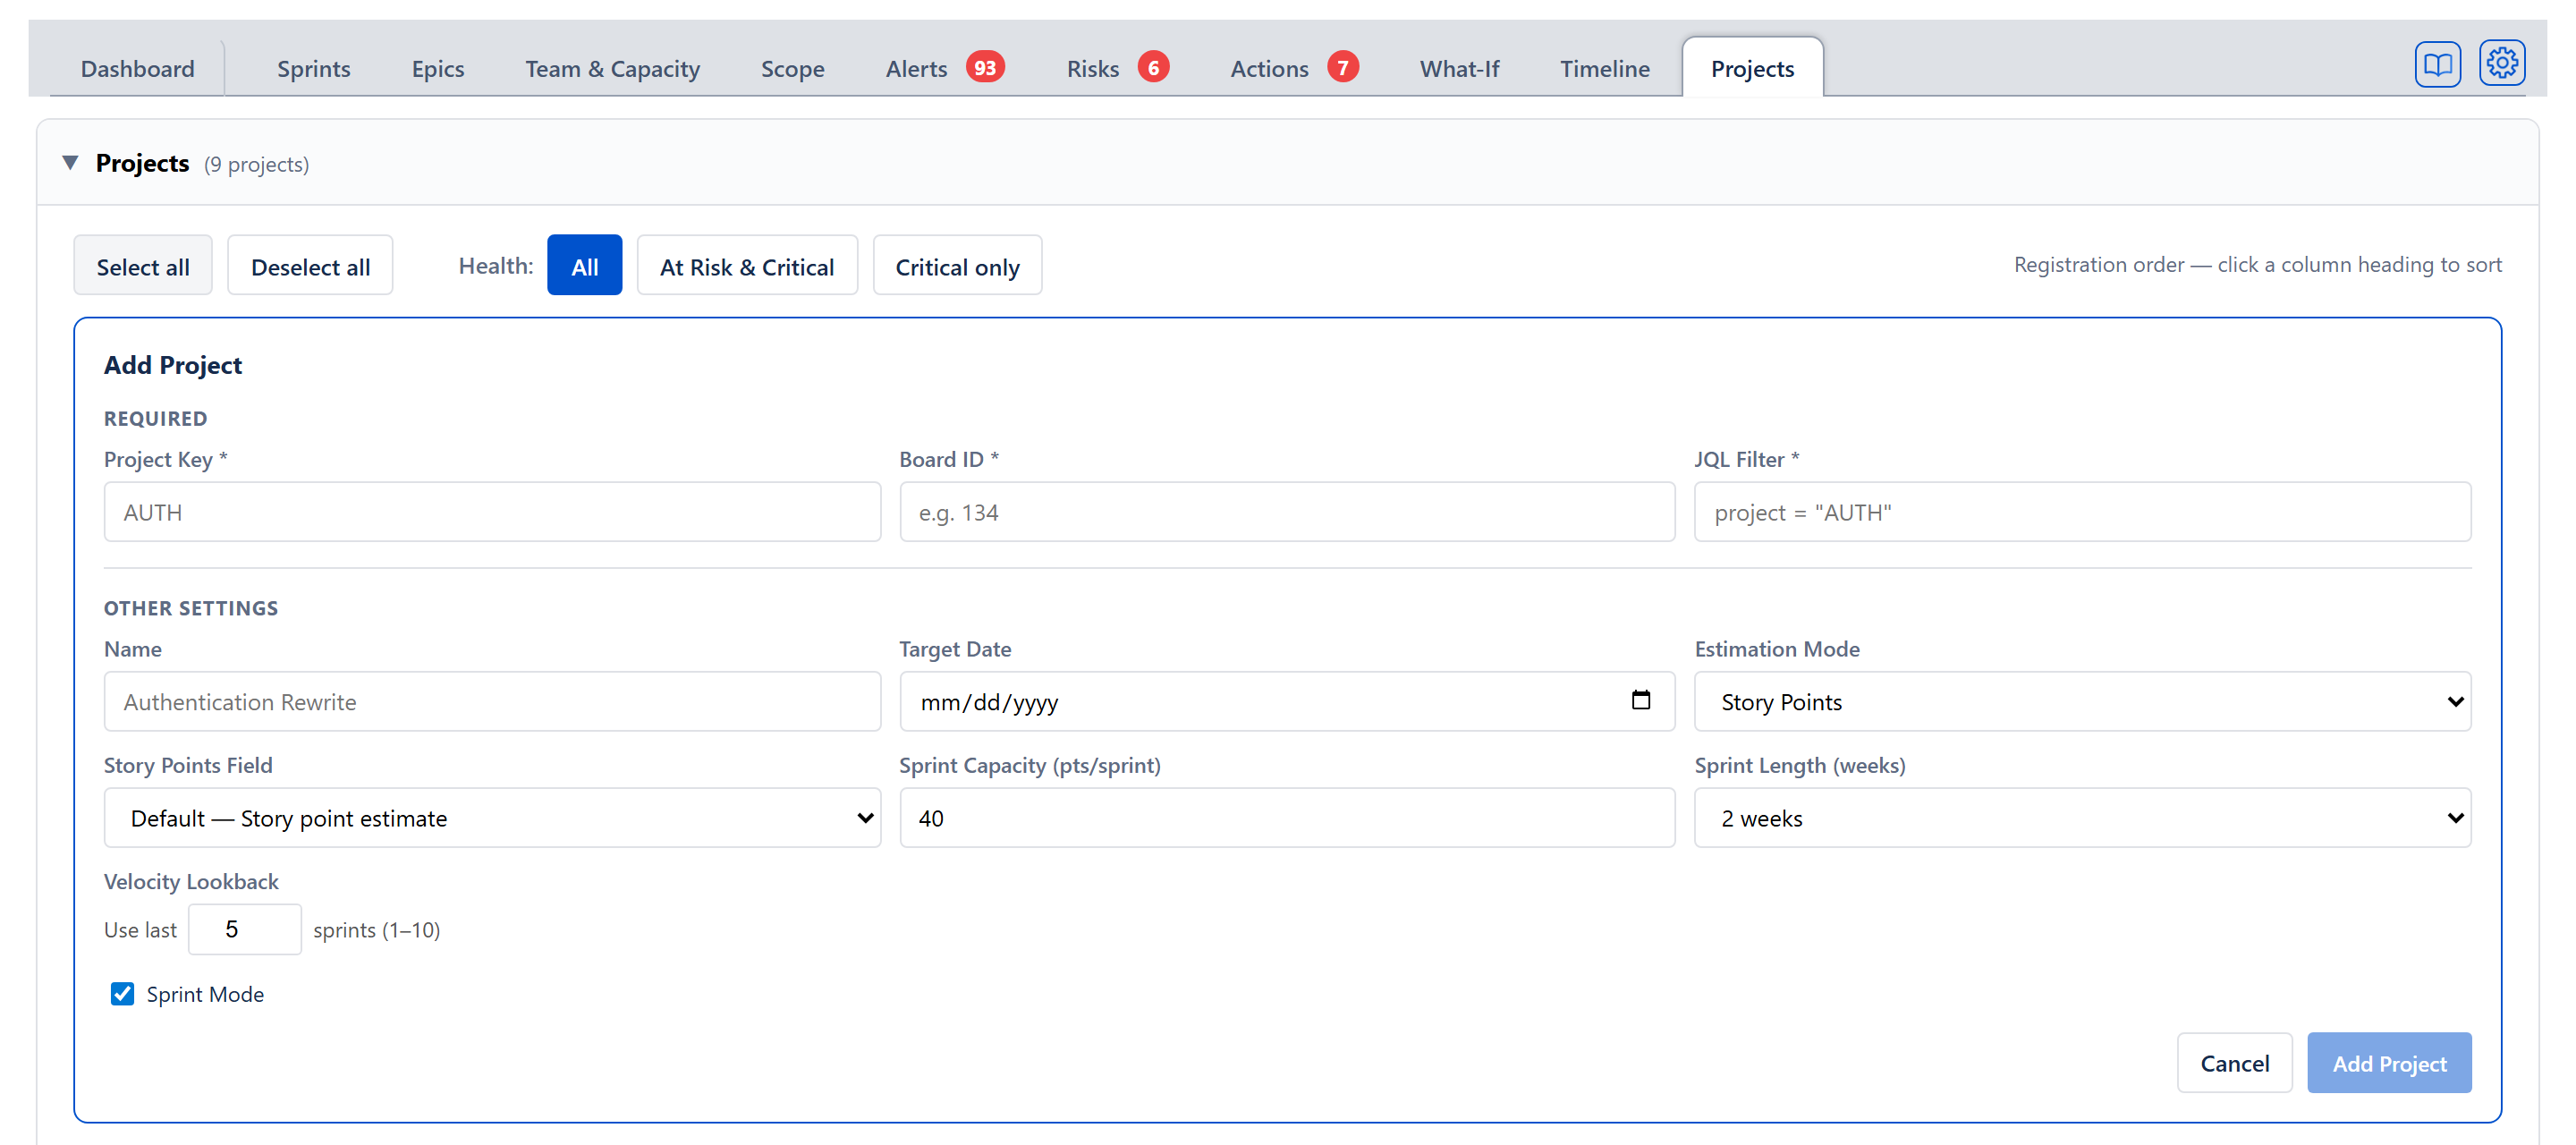
The form is key-first: type the Project Key and leave the field, and the app checks the key against your Jira site and fills in what follows from it — the project's real name, the standard "everything in this project" JQL filter, and the project's board. A key Jira doesn't recognize is flagged immediately next to the field. When the project has exactly one board it is selected silently (a note names it); with several boards the Board ID field becomes a short named picker; with none (or when the lookup is unavailable) the field stays manual. Auto-fill never overwrites anything already typed.
The form is headed Add Project (or Edit Project) and has two groups, Required and Other Settings, followed by the Sprint Mode checkbox and the Cancel and Add Project (or Save Changes) buttons.
Required fields:
- Project Key — short uppercase id (e.g., AUTH); checked against Jira on leaving the field. A key Jira does not know reads No project with key "…" was found on your Jira site. under the field. The Add Project button at the foot of the form is greyed out until the Project Key, the board (where the project needs one) and the JQL Filter are all filled in, and resting the pointer on it says which are still missing; on Edit, only the Project Key is required.
- Board ID — Jira board id; the engine fetches sprints and issues from this board. Found automatically from the key for most projects: with one board a note under the field reads Board found: <board name>; with several the field becomes a dropdown reading Pick the project's board…, with Enter a board number manually… as its last choice; with none the note says no board was found and the number is typed by hand. Needed only while the Sprint Mode box at the bottom of the form is ticked: untick it and the Board field is replaced by a note saying no board is needed — the project's work comes from the JQL filter and its Team & Capacity settings are filed under the project key (2026-09-05, proposal 53 Phase 2).
- JQL Filter — Jira-Query-Language filter selecting the issues that belong to the project; pre-filled from the key, editable for narrower slices.
Other settings, in the order the form shows them:
- Name — human-readable (defaults to the key).
- Target Date — a date typed here is the project's fixed target, unless the project's Date source has been set to work the target out instead (for example Latest issue due date in the Target date card's gear on the Dashboard); the table's Target column always shows the computed target (see below).
- Estimation Mode — Story Points or Time. When Time is chosen, a Time Unit picker appears for Hours or Days (1 day = 8 hours); the choice is saved per project and every screen shows that project's time estimates and capacity in the chosen unit.
- Story Points Field — shown only in Story Points mode. Picks which Jira custom field this project's story points are read from (and written to, for inline edits). Jira sites store points in different fields — team-managed projects use Story point estimate (the default), company-managed ones use a separate Story Points field — and reading the wrong one makes every issue look unestimated. The dropdown lists the site's story-points-like fields with how many issues hold values in each, plus a Custom field number… entry; on Add, the evidenced field is pre-selected automatically when the default field is empty and exactly one other holds values. Full behavior, including the wrong-field notice on the Dashboard and Alerts tab, is described in the Settings Reference.
- Remaining Work — appears only when Estimation Mode is Time. Picks the ONE way unfinished work is counted everywhere for this project — every card, chart, demand figure, the weekly digest, and the delivery forecast engine alike: Committed size (full until Done) (the default — a task counts at its full estimated size until it is Done, and logged time never shrinks it) or Live estimate (after logged time) (a task counts at its Jira remaining estimate, which shrinks as work is logged). In Story Points mode the two are identical, so the control is hidden. Whichever basis is chosen, a screen's Burned % and Remaining % always sum to 100.
- Sprint Capacity — the capacity of every sprint that has not been given a number of its own, in BOTH kinds of project: story points a sprint, or hours or days a sprint. Default 40; a field left blank is saved as 40, while a typed 0 is saved as 0 — a real answer, not a blank. The label carries the unit, for example Sprint Capacity (pts/sprint) or Sprint Capacity (hrs/sprint); with Sprint Mode unticked it reads Capacity (pts/period) and the number is the capacity of each planning period. Changing the time unit changes the number with it — hours to days divides by eight, days to hours multiplies by eight, and a line under the field states what it became. Switching between story points and time clears the field instead, because the two cannot be converted into one another.
- Hours per story point — appears only when Estimation Mode is Time, default 4. How many hours one story point is worth, for issues estimated in points on a project estimated in time. Every screen that has to express point-estimated work in time reads it: the Can We Deliver row on the Dashboard, the Demand vs Capacity chart on the Scope tab, the Epics budget, and the Critical Chain demand model with the schedule behind it.
- Sprint Length (weeks) — 1 / 2 / 3 / 4 weeks, default 2. With Sprint Mode unticked it reads Period Length (weeks): how long one planning period is.
- Velocity Lookback — Use last [N] sprints (1–10): how many recent sprints are averaged for rolling velocity, default 5. It is the same shared value as the Use last N sprints box behind the Delivery Forecast card's gear on the Dashboard, Scope and What-If tabs (that box shows only while the card's Capacity model is Velocity, or Throughput without sprints) and the Lookback dropdown under the Velocity button on the Sprints tab. With Sprint Mode off the same field reads Throughput Lookback and counts periods: how many periods of finished work the Throughput capacity model averages over (added 2026-09-13; until then the field vanished with Sprint Mode off).
- Sprint Mode — a checkbox below the other settings, ticked by default. Unticked, the project has no sprints: its work comes from the JQL filter, the Board field is not needed, the Sprints tab is replaced by a tab named Tasks, and the sprint fields above are renamed for planning periods rather than hidden.
Before Add Project saves anything it checks with Jira: a Board ID that is not a number, a board Jira cannot find, or a JQL filter Jira rejects each stops the save with a red message saying which, and the button reads Checking filter… while it asks. Registering the same key with the same JQL filter twice is refused; the same key with a different filter is allowed, so one Jira project can be registered as several slices. When the checks pass, the project is saved and its data is read from Jira.
Edit / Delete
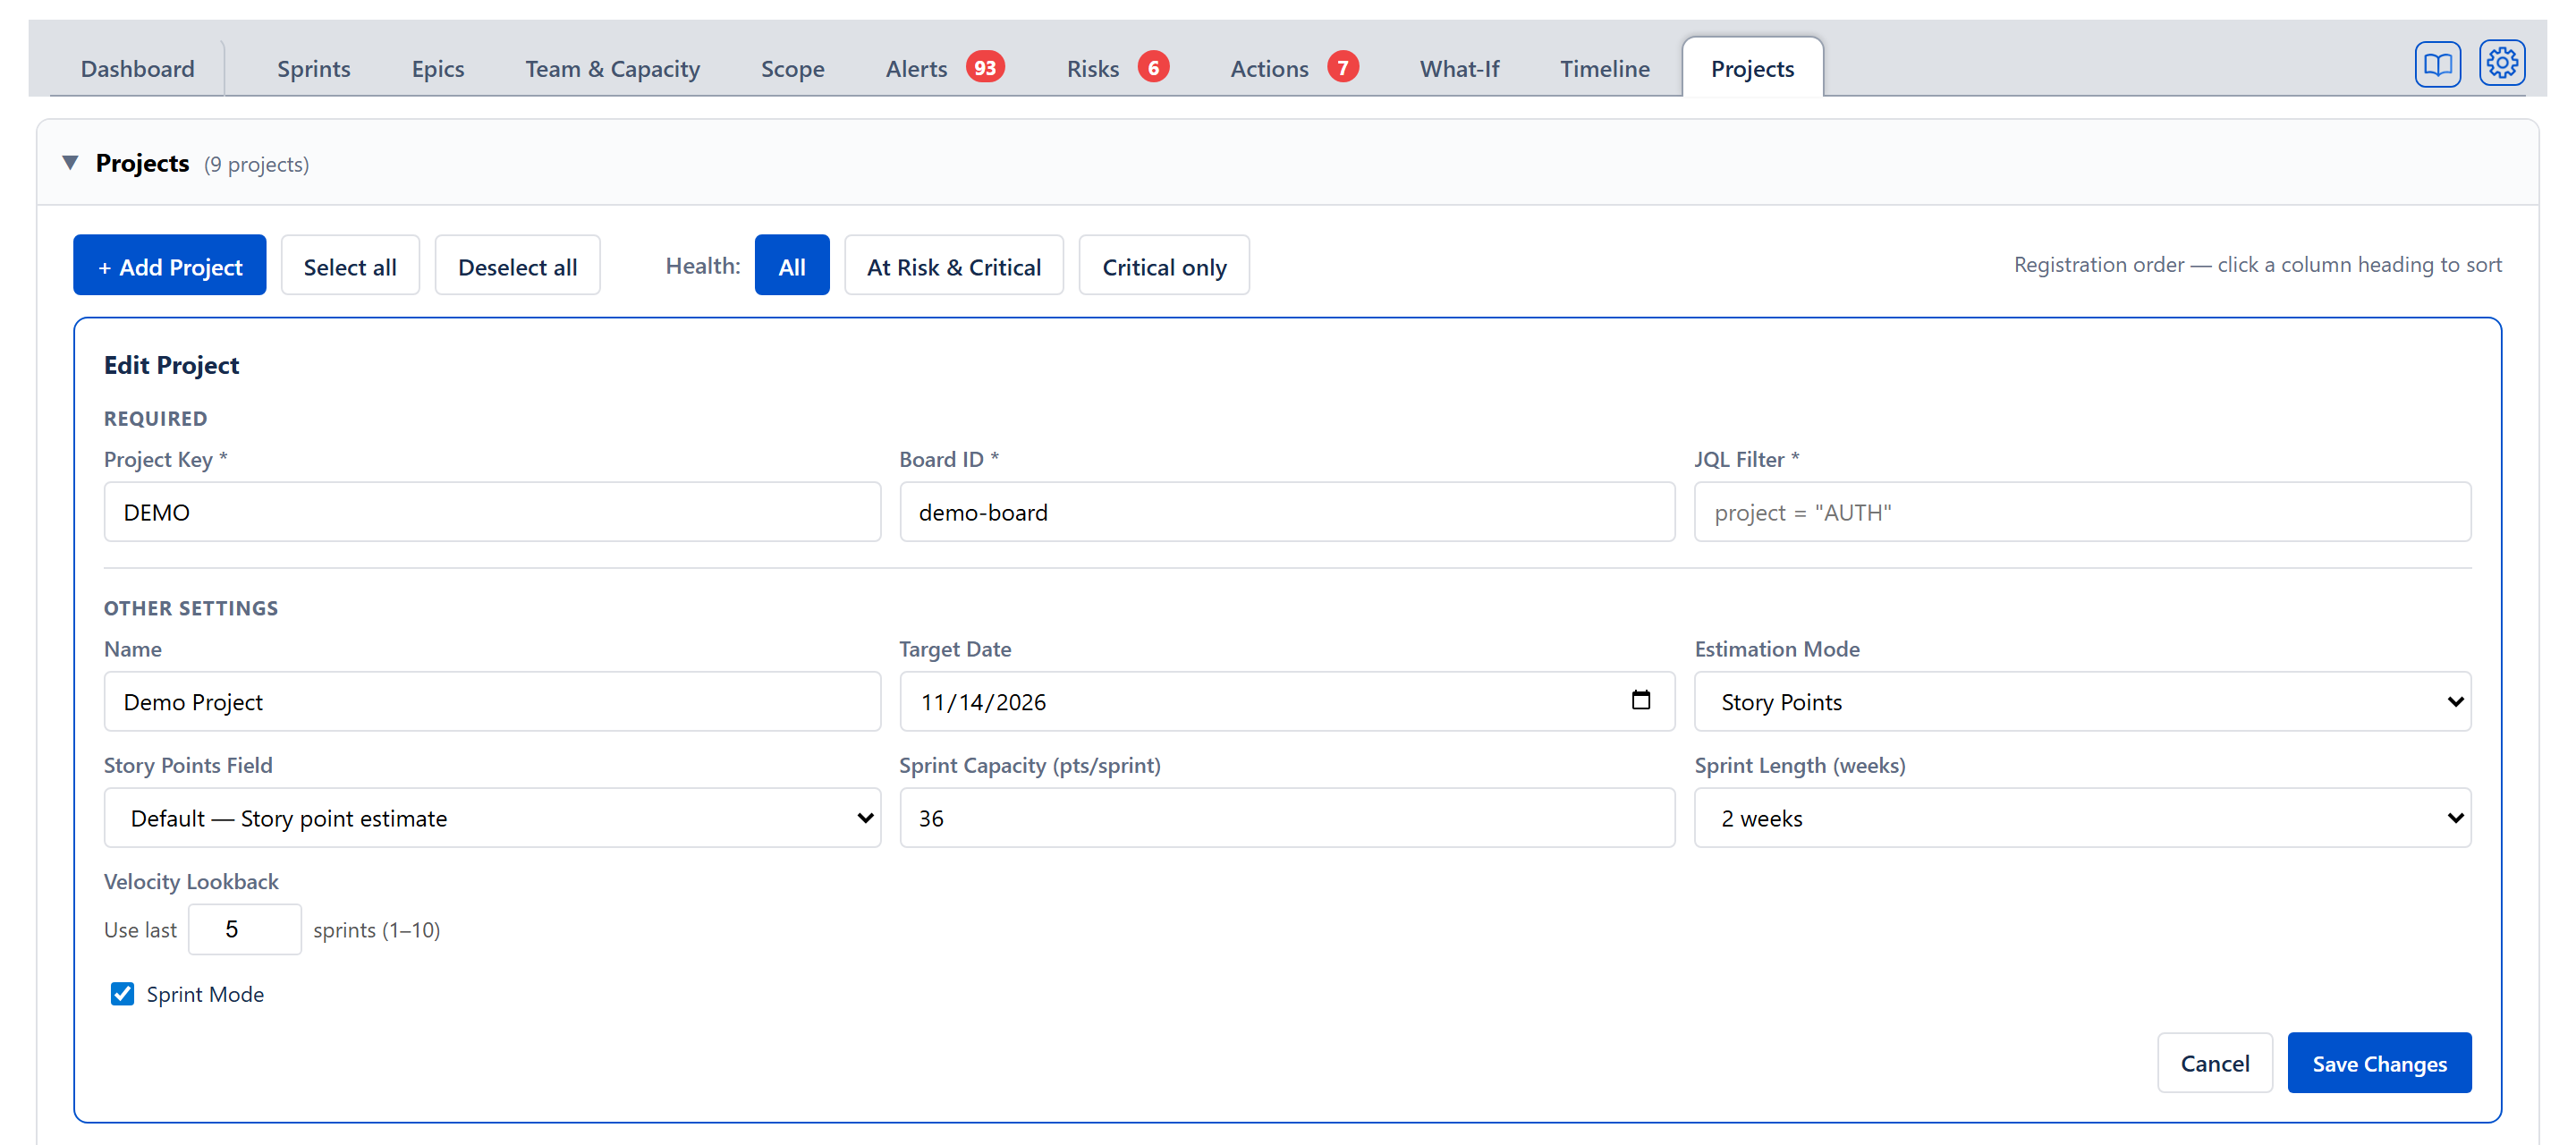
Each project row has Edit and Delete buttons. Edit opens the same form as Add, pre-filled with the project's saved settings; the user can change any of them, and only the project key is required — so settings can be edited even when board ID or JQL are missing. The project's record is the one home of every setting it has (since 2026-09-04): a value changed here is the value the Dashboard, Scope, What-If and Sprints tabs read, and a value changed through one of their card gears or capacity controls shows here on the next Edit. This is also where an existing project's Story Points Field is corrected: the wrong-field notice on the Dashboard and Alerts tab points here, and after saving a different field the project's data refetches and every screen re-reads points from the newly chosen field. Editing never changes the stored field on its own — the automatic pre-selection from detection applies only when adding a new project. Delete opens a dialog headed Delete project? that names the project and its JQL filter and says it cannot be undone, with Cancel and a red Delete button; on Delete, the project is removed together with its allocations, its cross-project dependencies, and its board's saved team. People who belong to no other project go with it (2026-09-02): anyone whose every share was of this project, or who has no share of any project, is removed from the team, and the dialog names them before you confirm; a person with a share of another project stays. When the deleted project was the one being shown and one project remains, every tab switches to the remaining project at once — its board, filter and people — with no reload. Choosing a project in the selector at the top right does the same (2026-09-03): the app's stored board, filter and capacity settings become that project's, so the Dashboard, Sprints, Team & Capacity and the rest all read its board; Program view leaves the stored board where it was. On a reload the selector starts on the project whose board is stored.
Active checkbox — include or exclude a project app-wide
The leftmost column of the portfolio table is Active: a checkbox per project, ticked by default (including every project registered before the checkbox existed). It decides whether the project is included anywhere in the app.
- Ticked (active) — the project appears everywhere it does today: the project dropdown in the top bar, the Program view union, the Dashboard / Scope / What-If program views, the Actions and Risks project pickers, the Team Allocation Matrix columns, the allocation popover on Team & Capacity, the dependency dropdowns on this tab, and every rollup and forecast.
- Unticked (inactive) — the project vanishes from all of those places at once and its Jira board is not fetched at all. Nothing is deleted: its settings, allocations, and declared dependencies are kept and return when it is re-ticked.
- On this tab the inactive project's row stays visible — greyed, with an Inactive tag next to its name and its stat cells showing dashes — so it can be re-activated. Its checkbox, Edit, and Delete buttons remain fully usable; saving an edit keeps it inactive and never steers what the other tabs show.
- The Projects section subtitle reads X of N projects active whenever the two counts differ.
- If the project selected in the top-bar dropdown is deactivated, the app switches to the first active project.
- Deselect all (0 active) locks every other tab: navigation is pinned to the Projects tab with a notice — All projects are inactive — tick at least one project's Active checkbox on the Projects tab. The other tabs unlock once a project is active. — the same mechanism as the first-run lock. Tick any project (or Select all) to unlock.
- In demo mode, re-entering demo resets to the demo baseline, where every project is active.
Portfolio dashboard table
One row per registered project — active ones with live stats, inactive ones greyed with dashes (see the Active checkbox section above). Columns:
- Active — the include/exclude checkbox described above.
- Project — uppercase key + name. A red ⚠ dep badge appears when the project has an active dependency violation; an Inactive tag appears when the row's checkbox is unticked.
- Health — coloured pill: Healthy (green), At Risk (orange), Critical (red). Hovering shows the exact reason.
- Progress — bar + percentage of work complete (done estimate ÷ total estimate), worked out the same way as that project's Progress card on the Dashboard, including its Include backlog setting.
- Forecast — the projected completion date from the same forecast as that project's Delivery Forecast card, written as the cards write a date (Nov 22, 2026); Complete when nothing is left, Does not fit the plan when the remaining work does not fit in the project's planned sprints (the forecast counts only planned capacity, so no date is given), Never when the plan can't finish, or — when there is no projected date.
- Target — the project's computed target date, read-only: the same date that project's Target date card shows, written the same way. It is the date on this project's own Add / Edit Project form; a date typed into the Target date card's gear is written to the same record, so the two can no longer differ (2026-09-03 — they did: 4 May in this table against 24 December on the card). When the project's target is a fixed date, that date; otherwise the latest due date among its unfinished issues (or the last open sprint's end when the method is Latest sprint end). A date typed in the Target Date field of the Add Project / Edit Project form counts as a fixed date unless the project's Date source says otherwise. Each project's row reads that project's own settings only: a project with no date of its own never borrows the date of whichever project is selected in the top bar (15 October 2026). A project with no derivable target reads —.
- Slack — calendar days between the forecast and the computed target above (the same two dates shown in this row), written like +12d or -5d. Green when ≥ 0, red when negative. — when the Forecast has no date (Does not fit the plan, Never, or no forecast) or there is no target.
- Scope — total estimate of in-scope issues, including done work, read-only, in the project's own unit (pts, hrs or days). Cancelled work is left out, and without Include backlog only sprint issues and done issues count. In a time project each issue counts at its original estimate, falling back to the remaining estimate. To model a scope change, use the What-If tab's All Projects view.
- Velocity — the project's average work completed per sprint, in its own unit, over the look-back window set in Velocity Lookback on its Add / Edit Project form. It is the same figure the Sprints tab's Avg velocity card shows for that project and the figure the Forecast is based on. A dash until a sprint has been captured. Sortable, so the portfolio can be read by delivery rate (added 2026-09-13).
- Utilization — the remaining work as a percentage of the capacity the Delivery Forecast counts for that project (see How the numbers are computed); green up to 85%, amber above 85% up to 100%, red above 100%. When work remains and no capacity is left before the target date, there is no percentage to give: the cell reads No capacity in amber, and hovering it says how much work remains (27 September 2026; it used to read 999%). A dash when there is nothing to show.
- Team — count of active team members on the project, read-only. Team size comes from the registered members and the allocation matrix; to model adding or moving people, use the What-If tab's All Projects view.
- Alerts — two count badges, errors in red and warnings in amber, counted exactly as the Alerts tab counts them for that project (checks switched off and findings dismissed are left out); the word Clear in green when there are none.
- Estimation — how many of the project's unfinished issues carry an estimate (story points in a points project; an original or remaining estimate in a time project). Reads N% est. in green when no more than 10% are unestimated, and N% unest. in orange when more than 10% are.
- Actions — Edit, Delete.
The portfolio table is a read-only monitoring view: every cell reports a value, and the only interactive controls on each row are the Edit and Delete buttons.
Sorting
Every data column heading is clickable. The first click sorts by that column with the worst news first — most negative Slack first, Critical health first, highest Utilization first, lowest Progress first, most Alerts first, and the highest share of unestimated issues first under Estimation. The second click reverses it. The third returns the table to registration order. A small arrow on the heading shows which column is sorted and which way it is running.
Columns with no "worst" end simply read in their natural order on the first click: Project alphabetically, Forecast and Target by date, Scope, Velocity and Team from lowest to highest. The two control columns — the Active tick and the Edit / Delete buttons — are not sortable, because ordering by them would fight the rule below that inactive rows sit at the bottom.
Rows whose cell in the sorted column is a dash sort after every row that has a value, whichever way the column is running.
Filtering by health
Three buttons above the table — All, At Risk & Critical, Critical only — narrow it to projects whose Health pill matches. The default is All. When a filter leaves nothing to show, the table body reads No projects match this filter and the buttons stay on screen to click back to All.
What sorting and filtering never do
- They are viewing choices only. Nothing is saved: reloading returns to registration order and All. They change nothing about the projects and write nothing to storage.
- Inactive projects always group at the bottom in registration order, whatever the sort — their stat cells are dashes, so ordering them among live rows would mean nothing. The health filter never hides them either, so an inactive project stays reachable for re-activation.
- The programme rollup row stays pinned at the bottom and its figures always cover the full active portfolio. The filter changes which rows are displayed, never what the rollup adds up.
Programme rollup row
When at least two ACTIVE projects exist, a footer row sums the active portfolio (inactive projects are excluded from every rollup figure):
- Program (N projects) — label, with , N loading added while any project is still being read.
- Health — Critical if any is critical, At Risk if any is at-risk, else Healthy.
- Average Progress — reads like 57% avg.
- Total Scope — one total for each unit the projects use, each beside its unit and never added to another: 1117 pts · 1780 hrs for a portfolio of points and hours projects, a single total such as 445 pts when every project uses one unit (27 September 2026; it used to add points and hours into one number with no unit).
- Total Team — count of team members engaged through at least one ACTIVE project. A member whose only allocations point at inactive projects is not counted (nothing is counted for an inactive project anywhere); a member registered with no allocations at all still counts — they belong to the programme without being tied to any project.
- Alerts — the errors and warnings of every active project added together (blank when there are none).
- Forecast, Target, Slack, Velocity, Utilization and Estimation read — in this row: each project has its own.
Team Allocation Matrix
Below the project table, a folding section headed Team Allocation Matrix with the member count, for example (4 members); it is closed when the tab opens. Inside is a members × projects grid, with a Member column first. A couple of internal demo-only projects are hidden from this grid. With projects but no team members registered, it reads Register team members to see capacity allocation across projects. Each member can be split across multiple projects (e.g., 60% Auth, 40% Pay).
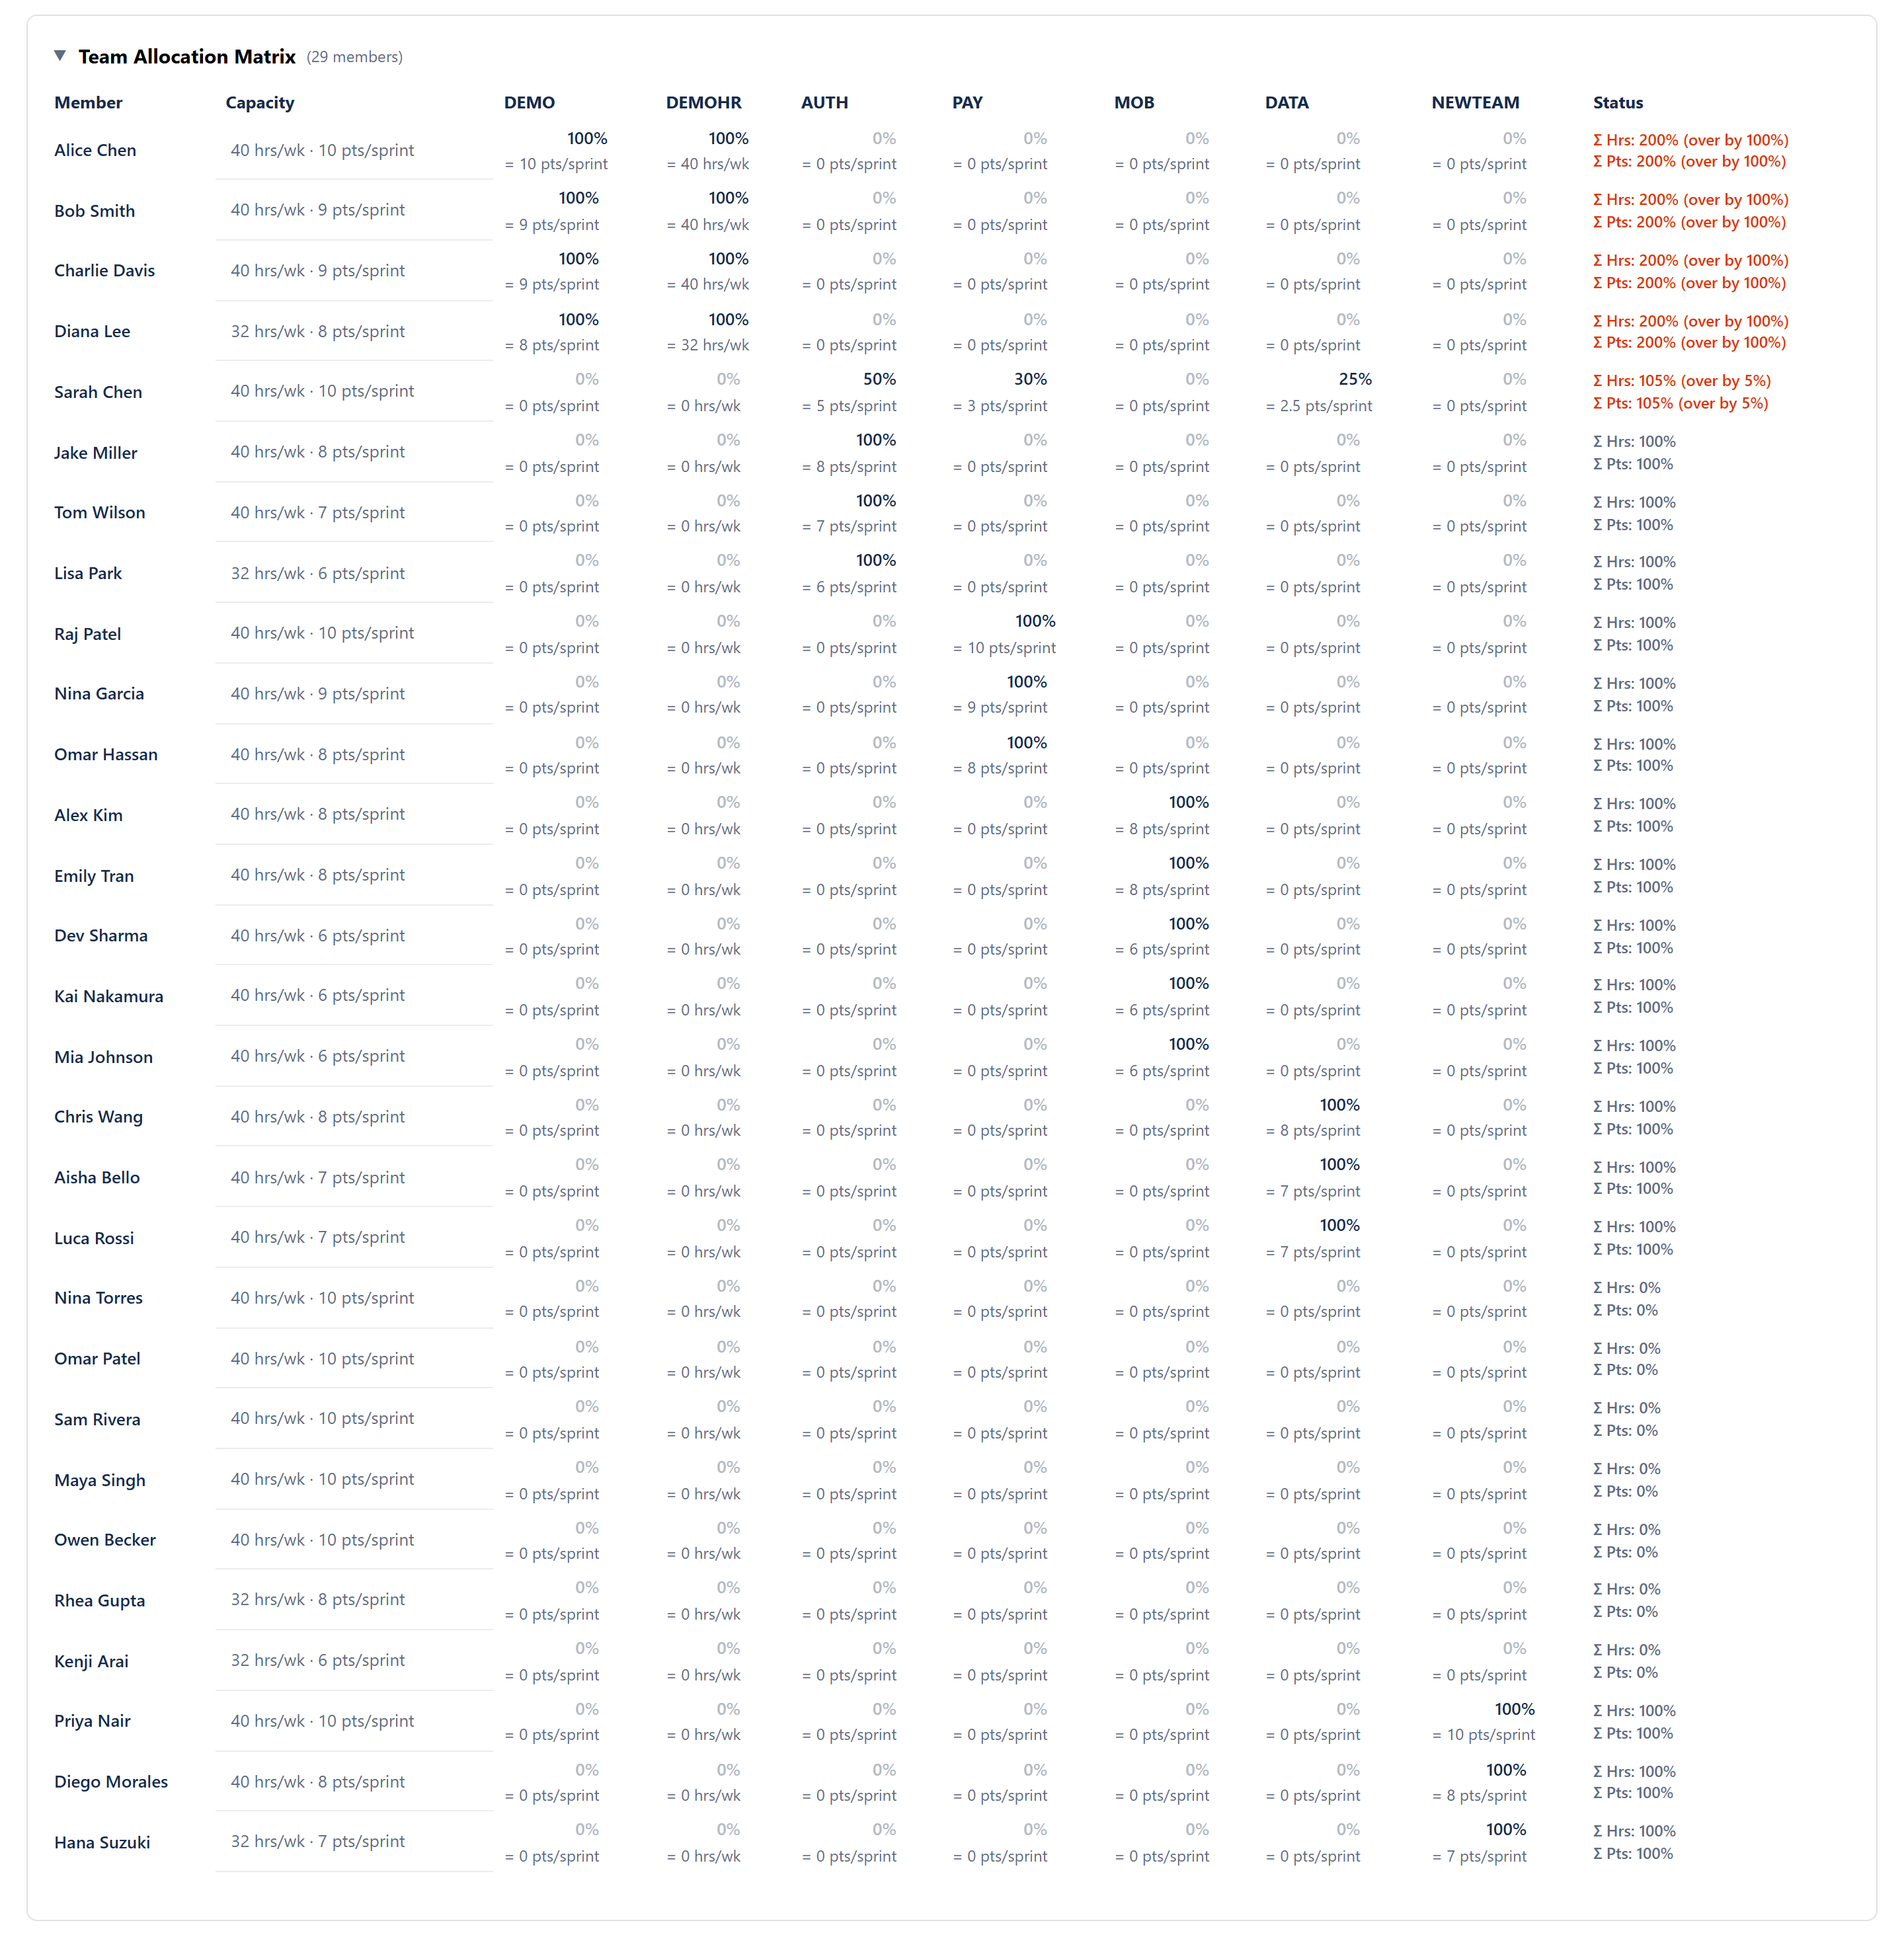
- Rows — every registered team member.
- Columns — every visible ACTIVE project (inactive projects' columns are hidden; their stored allocations are kept).
- Capacity column — base capacity per member, written like 40 hrs/wk · 10 pts/sprint.
- Status column — running percent totals across visible projects, Σ Hrs: X% and Σ Pts: Y%. When a total is over 100% that line turns red and adds (over by N%); each line is checked against 100% on its own. Both totals read each share the same way the cells do, so a share stored only in points still counts on the hours line.
Cell contents (read-only here)
Each cell shows two stacked values, read-only on this tab:
- Percent — the share of the member's capacity dedicated to that project (e.g., 50%). The unit matches the project's estimation mode — points for points-mode projects, hours for time-mode — and when nothing is stored in that unit, the share stored in the other unit is shown, because it is the same share of the same person.
- Computed "= X" line — the absolute value the percent works out to at the member's current capacity, labelled with its period (pts/sprint for points, hrs/wk for hours).
To change an allocation, click a person's cell in the Alloc column of the roster table on the Team & Capacity tab (the column appears once at least one project on the Projects tab is ticked Active) to open the allocation popover, where editing either the percent or the "= X" value updates the other and saves immediately to the same program store. Storage is percent, kept in both units, so toggling a project's estimation mode never loses data.
Over-allocation
The matrix does not clamp totals. Over-allocation is preserved verbatim and surfaced through the Status column's red text, so the cost of putting Sarah on five projects is visible rather than silently capped. Forecasts respect the actual loaded allocation, so the consequences of over-allocation show up in the per-project Utilization and Forecast columns.
Capacity-change live update
Changing a member's hours per week or points per sprint (in the Team & Capacity tab) immediately updates every "= X" display in this matrix and the Alloc popover, without re-entering any percents. A 60% allocation stays 60% across capacity changes — that's the intent the planner expressed, not the absolute number.
Feeds the program Delivery Forecast
The per-project allocation set here is also applied when the Delivery Forecast rolls a program up — the Program View on the Dashboard and Scope, and the All Projects sub-view on What-If. Each project is forecast on its team's allocated capacity, so a person split across projects counts at their share on each project rather than at full capacity on every one (which would make the program look faster than it is). Set the real split here for a true program forecast; a person left at 100% on more than one project is still counted in full on each.
Critical Chain panel
A collapsible Critical Chain section sits below the Team Allocation Matrix and shows the longest, most-constrained path of work that determines the programme end date. It is the same engine documented in ALGORITHMS section 7 (Critical Chain) — chain confidence, per-resource summaries, feeding paths, due-date risks, epic grouping, and team-pool overflow. When Program view is chosen in the project selector at the top right, the chain is computed across every active project; otherwise it is filtered to the selected project.
Opened, the section explains in a few short paragraphs what the chain is and the five things each open issue is scheduled by — its remaining estimate at the pace of whoever holds it, its blocks links, that person working on one thing at a time, the days that person is not at work, and its issue or sprint start — then draws the chain diagram. Work held by someone with no capacity typed on the Team & Capacity tab cannot be scheduled, and an amber note above the explanation names it: Not on the chain: <person> has N tasks (<keys>) and no capacity typed on the Team & Capacity tab. With no open sprint holding work it reads No sprint data (Load a Jira board to see the critical chain); when every task fits it reads No bottleneck detected (All work fits within team capacity. No single resource is driving the delivery date.); and if the chain cannot be worked out it reads Couldn't compute the critical chain. The section no longer has an AI question box: it was taken out on 6 October 2026, with every other place the app asked an AI model.
Cross-Project Dependencies
The last folding section on the tab, headed Cross-Project Dependencies with a count such as 2 deps. It holds a list and an Add form. With nothing declared it reads No cross-project dependencies declared. Add dependencies to model blocking relationships between projects — when an upstream project slips, downstream projects are automatically flagged.
Dependency violations
When at least one declared dependency has the upstream forecast past the downstream target, a red box headed Dependency Violations lists each one: PROJ_A is blocked by PROJ_B — upstream finishes N days after PROJ_A's target.
Declared dependencies
A list of every upstream → downstream statement with optional description and a Remove button.
Add dependency form
Three controls:
- Upstream (blocks) — dropdown (Select...) of ACTIVE project keys (inactive projects can't be picked; dependencies already declared on them stay listed but can't fire violations while inactive).
- Downstream (blocked by) — dropdown, same active-only rule; the project picked as upstream is left out.
- Description — optional human-readable reason.
Plus a + Add button.
Cascade rules
When a dependency violation fires:
- The downstream project is flagged as blocked, recording which project blocks it, when the upstream finishes, and how many days it is blocked.
- Its health is raised to At Risk if it was Healthy; left as Critical if already worse.
- If the upstream project itself has negative slack, the downstream's slack becomes
min(downstream, downstream + upstream)so the late chain propagates: a 10-day-late upstream eats 10 days off the downstream's slack. The downstream's health is then worked out again from that new slack, so it can become Critical.
Removing a dependency clears the violation flag in the next analysis pass.
Empty / loading / error states
- No projects registered — the table still renders with its column headers and an empty body; the Add Project form above is where you start. (A brand-new install never lands here first: the one-page setup screen — Project Key, Board, Issue filter, Story Points vs Time — appears before any tab, and its More options link is what leads to this form with the typed values carried over. See the Getting Started Guide.)
- Loading — projects are read from Jira two at a time, and each row fills in the moment its own reads finish. A row whose reads have not landed yet reads Loading… in its Health cell with the other figure cells empty, never 0%, so a project still being read is never mistaken for one with nothing in it. A project being read again after an edit keeps its figures until the new ones land. The Program rollup row at the foot of the table leaves a project that is still loading out of its average and totals and says so in its label (Program (3 projects, 1 loading)), so a project that has not arrived is never counted as zero.
Cross-cutting modes
- Estimation mode — when every project shares one unit, the rollup Total Scope cell shows one total in that unit; when they differ, it shows one total per unit side by side (1117 pts · 1780 hrs), never adding one unit to another.
- Sprint mode on/off — per-project; the sprint-only fields shift accordingly.
- Programs — choosing Program view in the project selector at the top right (offered when more than one project is active) aggregates every active project at once; the Critical Chain section and other views use this to know whether to filter by the selected project.
How the numbers are computed
- Forecast — the same delivery forecast the project's Delivery Forecast card on the Dashboard runs: the project's own issue list (after Include backlog), its capacity model from the card's gear (Each sprint's own setting by default with sprints, Team capacity without), its scope growth setting, and its computed target. Each project is forecast on its own record's settings — or the default where its record holds none — never on the settings of whichever project is selected in the top bar (15 October 2026). Does not fit the plan when the remaining work does not fit in the planned sprints; Never when that forecast says the work cannot finish; Complete when nothing is left.
- Slack —
target − forecastin days. When a project has no projected date (or no target), Slack is blank and the cell shows —. Negative when forecast is past target. - Health — Critical when the forecast reads Never or Does not fit the plan, or slack < −14 days; At Risk when slack < 0, when work remains with no capacity left before the target (No capacity), or when utilization > 120%; Healthy otherwise. A cross-project dependency violation also raises a Healthy project to At Risk (see Cascade rules). Alerts do not influence health (they have their own column).
- Utilization — remaining work ÷ the capacity the same forecast counts × 100, rounded. With work left and no capacity before the target date there is nothing to divide by, so no figure is given: the cell reads No capacity and the project reads At Risk.
- Cascade slack propagation — when upstream slack is negative, downstream slack =
min(downstream, downstream + upstream). See the ALGORITHMS Project Allocation section (Allocation in Scenarios and Cascades subsection).
Effects on other parts of the app
- The Active checkbox on each row decides whether that project exists anywhere else in the app: unticking removes it from the top-bar project dropdown, the Program view union, every program rollup and forecast, the Actions/Risks pickers, and the allocation surfaces, and stops its Jira board from being fetched — while this tab keeps the row for re-activation.
- The Team Allocation Matrix here shows the allocations set in the allocation popover of the Alloc column on the Team & Capacity tab. The matrix cannot be edited; a change made in the popover shows here straight away.
- Selecting a project in the project selector at the top right filters every other tab to that project; selecting Program view switches the Critical Chain section to programme-aware mode across the whole portfolio.
- Nothing on this tab is committed to Jira. The registered programme (projects + allocations + dependencies) is saved to the app's Atlassian Forge storage (scoped to your Atlassian account, removed on uninstall); cross-portfolio "what if" modelling is done non-destructively in the What-If All Projects view and is never written back.
- The dependency violations and cascaded slack are shown on this tab only: the ⚠ dep mark, the Health and Slack columns, and the Dependency Violations box.