 Project Commander Docs
← Back to site
Project Commander Docs
← Back to site
Team & Capacity Tab — Feature Guide
What it's for
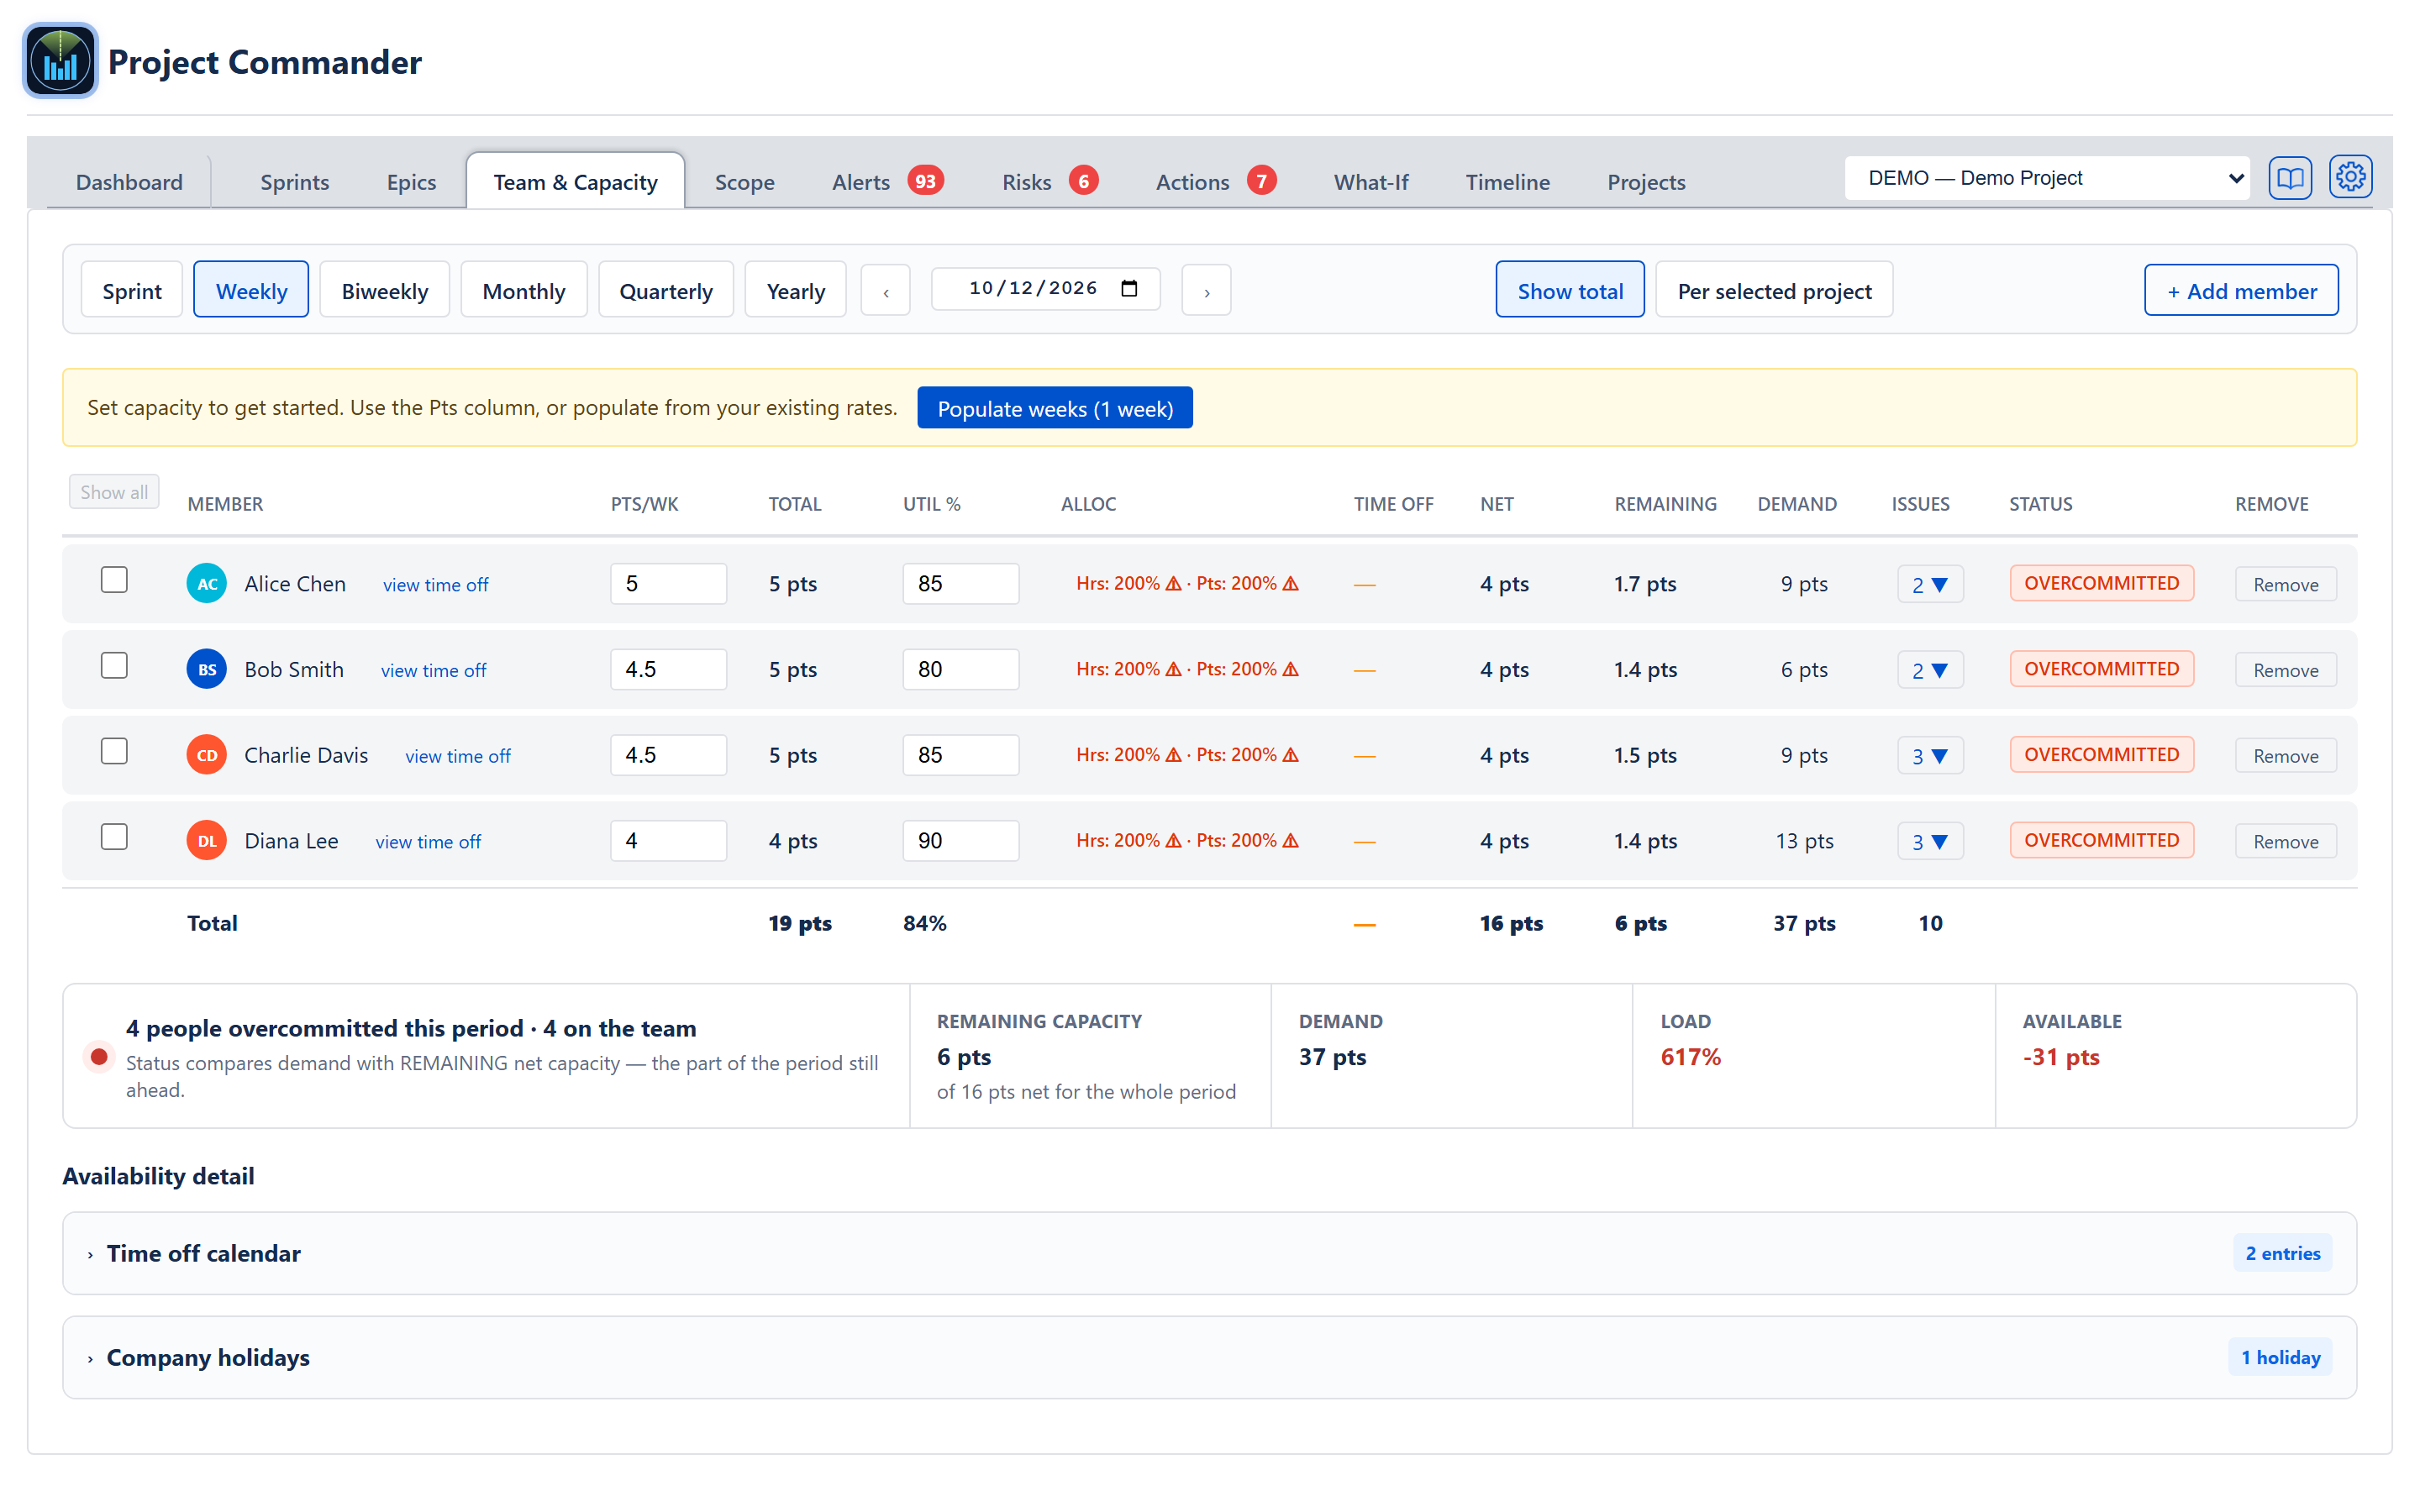
The Team & Capacity tab is where the team's roster, base capacity, time off, holidays, and per-project allocations are kept. Every other capacity-aware feature in the app — the Delivery Forecast card, the Project view on the What-If tab (its week-by-week plan), the Demand vs. Capacity section on the Scope tab, the sprint cards on the Sprints tab, Auto-Level — reads its inputs from here.
The tab opens on the period buttons and the roster table, and beneath the table its answer — a summary strip saying how many people are overcommitted. It does four things: lets the user manage the team roster (add and remove members); set capacity in points or hours for any period, stored week by week; track time off (PTO) and company holidays; and share each member's effort across several projects.
Nothing on this tab is written to Jira issues. The roster, capacity, time off and holidays are kept by the app itself (see Data persistence below). The one exception: removing a member can also unassign that person's open issues in Jira, if the user ticks that option in the confirmation.
Summary strip
A five-cell strip beneath the roster table (moved there on 2026-09-04 at Don's request so the tab opens simpler: the period buttons and the people first, the verdict and its four figures under them). It answers "is this team overcommitted, and by how much" from the same rows the table shows. It is shown only when the roster has at least one person.
- Verdict — a coloured dot (red when anyone is overcommitted, green otherwise) and a sentence: N people overcommitted this period (1 person overcommitted this period), or Nobody is overcommitted this period, followed on the same line by the size of the roster (· 4 on the team), counted from the same rows as the overcommitted figure. The count is the number of rows whose Status badge reads OVERCOMMITTED, taken from the same load rule the badges themselves use, so the two can never disagree. "This period" is whichever period the buttons above the table are set to. Beneath it, a line stating the rule: Status compares demand with REMAINING net capacity — the part of the period still ahead.
- Remaining capacity — the team's capacity in the part of the selected period still ahead of today. Underneath, in smaller type, the whole-period net figure it came from (of X pts net for the whole period), so both numbers are visible.
- Demand — total not-done work overlapping the period, for everyone it is assigned to (see the Demand column below).
- Load — demand as a percentage of remaining capacity. Turns red once demand exceeds what is left. When nothing is left and work remains, the cell reads No capacity left; when there is neither capacity nor work, it reads —.
- Available — remaining capacity minus demand; negative and red when the team is over.
The strip's Remaining capacity and Demand figures are the same values the Total row at the foot of the table shows, from one calculation.
Why "Load" and not "Utilization": three different measures would otherwise share one word. Util % in the table is a per-person availability setting (a number the user types). Utilization on the Projects tab is remaining work against capacity to the target date. Neither is demand against remaining period capacity — that is Load, the same term the Scope tab's Resource Breakdown uses and the name of the bands behind every status badge.
Header / Toolbar
Period selector
Six bordered buttons at the left of the period row — Sprint, Weekly, Biweekly, Monthly, Quarterly, Yearly. Weekly is selected when the tab opens. The choice changes the window the table adds up over and the unit of the capacity column. Underneath, capacity is always stored per calendar week; the period view is a convenience for setting many weeks at once and for reading totals at the right granularity.
Sprint (added 2026-09-01) steps sprint by sprint instead of by a fixed number of days, and changes the capacity column heading to Pts/Sprint or Hrs/Sprint. On a project with Sprint Mode turned off the button reads Period instead, and the heading reads Pts/Period or Hrs/Period.
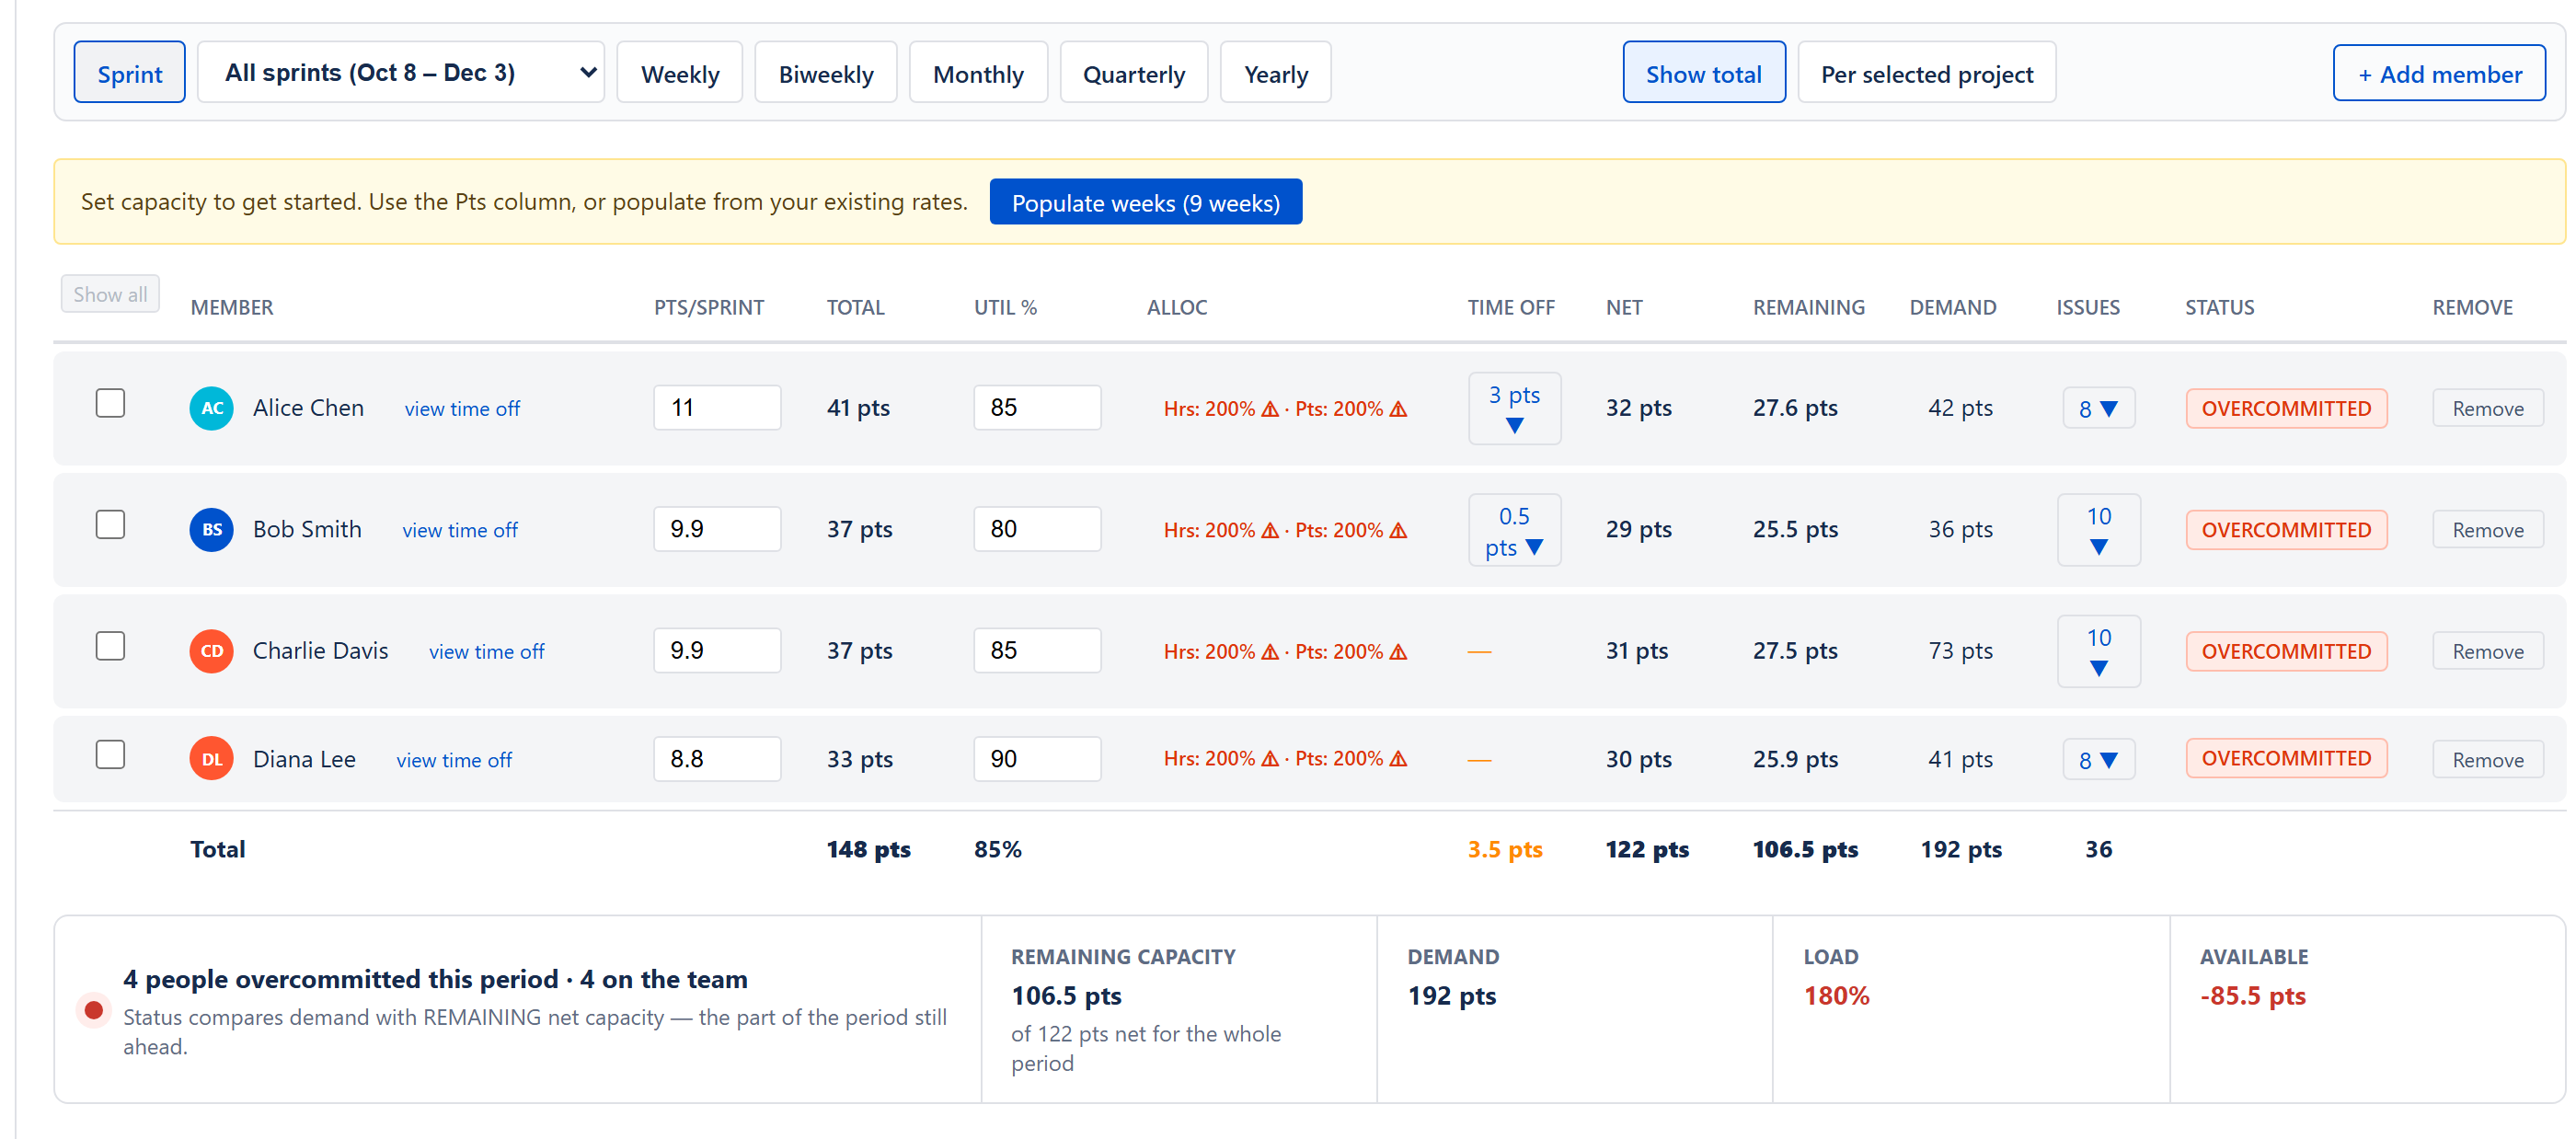
With Sprint chosen and the project having sprints with dates, a dropdown sits right after the Sprint button: it lists every sprint that has start and end dates, by name and dates, oldest first, plus All sprints — every active and future sprint, first start to last end (added 2026-09-02). With All sprints chosen the Total, Net, Remaining and Demand columns cover the whole span, and the Pts/Sprint column still shows one sprint's worth per person: a number typed there is set for every one of those sprints. It is the same number the Capacity cell in that sprint's card on the Sprints tab sets — both write to the person's weekly values, so neither screen can disagree with the other.
Because capacity is held per calendar week, two sprints that overlap a week share whatever is typed there — a sprint ending on a Wednesday and the next starting on the Thursday sit in one week. With Sprint chosen and one sprint picked (not All sprints), an amber line under the period row names the sprints that share a week with the one being viewed: This sprint shares a week with Sprint 8. Capacity is held per week, so a number typed here changes that sprint too.
Period navigation arrows
Arrows step the visible window forward or backward by one period, either side of a date box showing where the window starts. The date box is clickable: pick any date to jump straight to the period containing it. While the sprint dropdown is showing, the arrows and the date box are hidden — the dropdown is the whole control.
"Set capacity to get started" banner
Appears whenever the roster has people but nobody has any week-by-week capacity yet. It reads Set capacity to get started. Use the Pts column, or populate from your existing rates. (Hrs in a time project) with a Populate weeks (N weeks) button. Clicking it fills every week of the period currently shown, for every member, from that member's older single figure: hours per week (times their utilisation) in a time project, or points per sprint divided by the project's sprint length in a points project. Weeks that already hold a value are left alone. Once any member has weekly data the banner is gone.
The delivery forecast uses only the capacity in the planned sprints; nothing is carried past the last one. When the work does not fit, the Delivery Forecast card reads Does not fit the plan and says what to add, and when one person's work reaches furthest it names them at their own rate, worked out from the figures typed here — for example To finish, Ann would need about 12.5 more sprints at their 4 pts a sprint - add capacity for Ann, or move work to someone with room. Capacity is stored per calendar week, so a person given a figure for one week only has nothing in the sprints after it; those sprints are left out when their rate is worked out, rather than counted as zero, so a figure entered for a single week is not divided down into a fraction of a point a sprint. Work held by somebody with no capacity typed is named by the amber ⚠ mark after the Delivery Forecast card's title on the Dashboard and the Scope tab, rather than being silently spread across the team.
Add member button
At the right-hand end of the period row, a + Add member button opens the Add Team Member dialog:
- Name — as the user types, a list drops down of matching people who are assigned to this project's issues (people already on the roster are left out). Picking one ties the member to that Jira person; a name with no match can still be added, and the dialog says No match on this project — you can still add this name.
- Share of <project> — shown when a project is selected in the header, pre-filled at 100%, with the note How much of this person's capacity counts towards <project>. Change it later in the Team Allocation Matrix on the Projects tab.
- Cancel and Add buttons. Adding a name already on the roster is refused with "<name>" is already a team member.
The new member arrives with no capacity — nothing typed is no capacity, never a guessed figure (Don, 2026-09-01) — and the project's default utilisation; you type their capacity in the table. Their Pts/Wk (or Hrs/Wk) box reads empty until you do (26 September 2026 — it used to read 0, which is what you type when somebody is unavailable, so a roster nobody had filled in and a team somebody had zeroed looked the same). A typed 0 reads 0. Until a capacity is typed, the person's Net and Remaining columns read 0 pts (or 0 hrs): a 0 there means nothing typed or a typed 0, never a person fully booked. A person with nothing typed counts for nothing on the other screens, and the Critical Chain view lists their work as not on the chain by name rather than pacing it at a guess. People filled in automatically from a new project's assignees (the one-time pre-fill, which happens only when the project has no saved roster yet) each get 100% of that project — the same share a hand-added person starts with — so a capacity typed for them counts in full on the Sprints tab; split the share when a second project picks the same person up (2026-09-02).
Show total / Per selected project toggle
Two buttons on the period row, pushed to the right, shown whenever at least one project on the Projects tab is ticked Active. Show total (the default) shows each member's full capacity. To see one person's demand across every project added together, choose Program view in the project picker at the top right: the Demand column then counts their work in every registered project, and Show total reads it against the whole of their capacity, so a person shared between projects shows as overcommitted when their combined work is more than they have. Per selected project scales every capacity column by that member's allocation to the project currently selected in the header's project picker; it is greyed out until a project is picked there (hover text Pick a project in the header selector to enable). While it is on, a line under the period row reads Capacity scaled to <project> allocation %. Capacity fields read-only in this mode. (or Pick a project in the header to scale by allocation %. if the header's project is cleared while it is on) — the capacity and Util % fields cannot be edited, because they are scaled values, not stored values. Time off, holidays and demand still display unscaled.
Notices above the table
- An amber notice when the team has members set up but none of them is allocated to this project: N team members are set up, but none are allocated to this project — so Team capacity for it reads 0 and team-based forecasts stall. Set each person's allocation in the Team Allocation Matrix on the Projects tab (in pts). The unit at the end is the project's own: pts, hrs or days.
- An amber line, for six seconds, when an allocation typed in the allocation popover was cut back to fit within 100% (see Allocation popover).
- With nobody on the roster, the table is replaced by No team members yet. Click + Add member above to add one manually, or assign issues to people in your sprints. (the second half reads to start planning capacity on a project with no board or with Sprint Mode off).
Team Members table
One row per member, in alphabetical order. The headings read in capitals, as the mockup draws them, and each column's unit is carried by its figures rather than its heading. There is no heading band over the table and nothing that can collapse it — the screen runs period row, table, summary strip. The two availability sections beneath the strip, grouped under an Availability detail heading, do collapse.
Selection
- Select — a checkbox per row. Ticking a row filters the table to that single member; ticking it again clears the filter. While a member is selected a small bar above the table reads Showing 1 of N members with a Show all button, and the Show all button at the head of the checkbox column becomes clickable.
Identity
- Member — the member's avatar (a coloured circle with initials) and the display name, with a view time off link beside it, opening the per-member time-off dialog (described below).
Capacity (period bulk)
- Hrs/Pts per [Period] — the column heading adapts to the period and estimation mode: Pts/Wk, Pts/2Wk, Pts/Mo, Pts/Qtr, Pts/Yr, Pts/Sprint (or Hrs/… in a time project). In the Weekly view the figure is one week's capacity; in every other view it is the capacity for the whole period shown. Typing a figure and leaving the field divides it evenly across the working weeks of the period (a week only partly inside the period counts for its share of working days) and stores the result in every one of those weeks. When the weeks already differ, the field is empty with a varies placeholder until the user types a replacement.
- Total — the capacity across the period, before the utilisation factor and before time off (those are applied in Net), in the project's unit: pts, hrs, or days when the project counts time in days. In days it is the hours divided by eight, to one decimal place.
- Util % — utilisation as 0–100, in steps of 5. Uses the same per-week storage and bulk-edit pattern as capacity. A figure saved against the person rather than week by week is used for any week that has none of its own, and 100% applies only when neither has been typed. Until 9 October 2026 this tab replaced a saved figure with 100% for anybody who had no points-a-sprint figure — everybody on a time project, and everybody the app filled in from a new project's assignees — so a person saved at 50% available read as fully available here while every other screen counted them at half.
Allocation
- Alloc — shown whenever at least one project on the Projects tab is ticked Active. A button labelled with both totals on one line, Hrs: X% · Pts: Y% — the person's shares across the Active projects added up, with nothing after them (the /100% that used to follow each figure was dropped on 7 October 2026, because it was always the same hundred). Each figure is grey at or under 100% and red with a ⚠ marker over it. A person has one share of each project: a share set while a project counted in points still counts after the project is switched to time, and the other way round (Don, 7 October 2026). Clicking opens the allocation popover (see Allocation popover below).
Time off and holidays
- Time Off — what PTO plus company holidays in the period take off the person's capacity, the same amount the Net column takes off: in hours in a time project (for example 16h), and in points in a points project (for example 3 pts, a day's points for each day away), or — when there are none. Whenever the period holds any PTO entry or company holiday, the cell is a button with ▼; clicking it opens an inline detail row (described below).
Net capacity
- Net — capacity after utilisation and time off are both taken off, floored at zero, for the WHOLE selected period. In a time project a company holiday costs the member's own daily hours — their typed weekly hours, averaged over the weeks of the period, divided by five — and a day booked off costs the hours written on the booking, which is what a person who works twenty hours a week loses by taking a whole day (Don, 9 October 2026: "just the booking"). In a points project both cost their daily points (their weekly points divided by five), with time off booked in hours turned into days at eight hours to the day. A day that is both booked off and a company holiday is taken off once, not twice (Don, 7 October 2026). On a project that counts in days the figure is held in hours and divided by eight once, so twenty hours a week reads 2.5 days and not 3.
- Remaining — read-only: the capacity in the part of the selected period still ahead of today (ruling 2026-07-10). It is worked out over the working days still to come, exactly as the whole period's Net is worked out over all of them: the weeks typed for those days, less a company holiday or a day booked off that falls in them. A day already gone offers nothing, and a holiday or a booking on a day already gone takes nothing off what is left. From a Wednesday, a Monday-to-Sunday week leaves three of its five working days. A period wholly in the past reads 0; a wholly future period equals the Net value. This is what the Status badge judges demand against — capacity on days already gone can't absorb open work. Hovering over a member's Remaining figure says how many of the period's working days are still ahead.
Until 9 October 2026 this was the Net figure multiplied by the share of the period's calendar time that had not happened yet — four and five eighths days of seven from a Wednesday lunchtime. That assumed a person's capacity was spread evenly across the period, so somebody with nothing typed for this week and a full week typed for next was counted at four fifths of what they actually have left. Don's ruling: "Use the exact answer. The app should be as correct as possible. No guessing or estimating if there is actual data to use instead."
Demand
- Demand — the member's assigned issues that are not done and not cancelled, whose dates overlap the period — the stretch from the start date to the due date, or the one date when only one is set (issues with neither date count in every period). It counts every issue the project's issue filter finds, backlog issues included, whatever Include backlog is set to: that setting decides what the plan and the forecast count, not what this column does, so undated backlog work sits in every period's Demand even with Include backlog off. In a points project it adds up story points; in a time project it follows the project's Remaining Work setting (Committed size or Live estimate).
Issue count and inline expand
- Issues — the count of those same issues, shown as a number with ▼ (for example 3 ▼), or 0. When non-zero it is a button; clicking it opens an inline detail row listing each issue with key, summary, and points (or hours/days).
Status badge
- Status — one of OVERCOMMITTED (red), OPTIMAL (green), AVAILABLE (blue), UNDERLOADED (amber), or — when the person has neither capacity nor work. The decision compares demand against the REMAINING net capacity (the Remaining column — the period clipped to today-forward, ruling 2026-07-10) using the load bands: above 115% OVERCOMMITTED, 90–115% OPTIMAL, 60–90% AVAILABLE, below 60% UNDERLOADED. Open work against a period with nothing left reads OVERCOMMITTED. The worst band read OVERLOADED until 2026-09-11; it now says the app's one word for work that is more than the capacity can cover, the same word the sprint card's badge and the Dashboard's "Can We Deliver?" row use (Don's decision). Only that band moved: the other three say how much room a person has left, which is a different question and one those shared words cannot express. (The Sprints tab's per-member status column uses these SAME four bands, judged against the member's remaining sprint capacity, so a person reads the same status logic on both tabs.)
Removal
- Remove — a Remove button in plain sight at the end of the row, not behind a menu. Clicking it opens a confirmation titled Remove team member: Remove <name> from this project's capacity planning? Their capacity will no longer count. When that person has issues assigned in Jira, the dialog carries a tick box reading Also unassign their N issues in Jira, off by default — unassigning is the user's explicit choice, never automatic. Confirming removes them from the roster, and unassigns only if the box was ticked.
Per-member detail rows
Two inline expansions, plus the allocation popover:
Issues detail
Opened from the Issues cell. Lists every not-done issue assigned to the member that overlaps the period, with Jira key, summary, and size.
Time off detail
Opened from the Time Off cell. Lists every PTO entry in the period (date, reason, and what it costs) and every company holiday in the period (date, name, (recurring) for yearly ones, and what one day away costs that person). Each cost is in the same unit as the Time Off column — hours in a time project, points in a points project — so the lines add up to the figure on the row. There are no delete buttons in this detail row — remove time off from the calendar or the per-member time-off dialog, and holidays from the Company holidays section.
Allocation popover
A floating panel opened from the Alloc button. Its header reads Project allocations with a × close button. It lists every Active project on the Projects tab by key in a four-column grid (rows wrap when more than four projects exist); inactive projects are left out, and so are their allocations from the Σ totals. Each project card has two fields: a percent input (the share of this member's capacity dedicated to that project) and an editable "= X" line that shows the matching amount, labelled with its period — pts/sprint for points projects and hrs/wk for time projects. Edit either field and leaving it (or pressing Enter) saves the change; the other field recomputes from the member's current capacity. A single project cannot go above 100%, and a member's total across all projects cannot go above 100%: a larger figure is cut back, and an amber line at the top of the tab says so for six seconds (<name> is already N% allocated to other projects — capped at M% here so the total stays within 100%., or Allocation is capped at 100% per project.). Two Σ chips at the bottom sum the percents per unit — Σ Hrs: X% and Σ Pts: Y% — each turning red with a ⚠ marker when its total exceeds 100%. Setting a share to 0 sets it to 0 in both units. The popover closes on a click anywhere outside it (including the Show total and Per selected project buttons), Escape, the × button, or re-clicking the Alloc button.
Percent storage is the source of truth: when the member's capacity is edited in the row, every "= X" value in their popover updates immediately without any allocation edit. A 60% allocation stays 60% across capacity changes — that's the intent the planner expressed, not the absolute value.
Zero-allocation confirm
When the user edits an allocation in this popover from above zero down to zero and the member still has unfinished work assigned to that project (counted from the project's sprints, plus its backlog when Include backlog is on), a confirmation opens before the change saves. The title reads Zero allocation with assigned work; the message names the member, the project key, and the count of unfinished issues (e.g., "Sarah Chen has 3 unfinished issues assigned in AUTH. Setting allocation to 0 will leave them with no capacity for this project. Continue?"). The user picks Cancel (the field goes back to its previous value) or Set to 0 (the allocation is zeroed and the forecast recomputes). It does not fire when the member has no open issues on the project.
Per-member time-off dialog
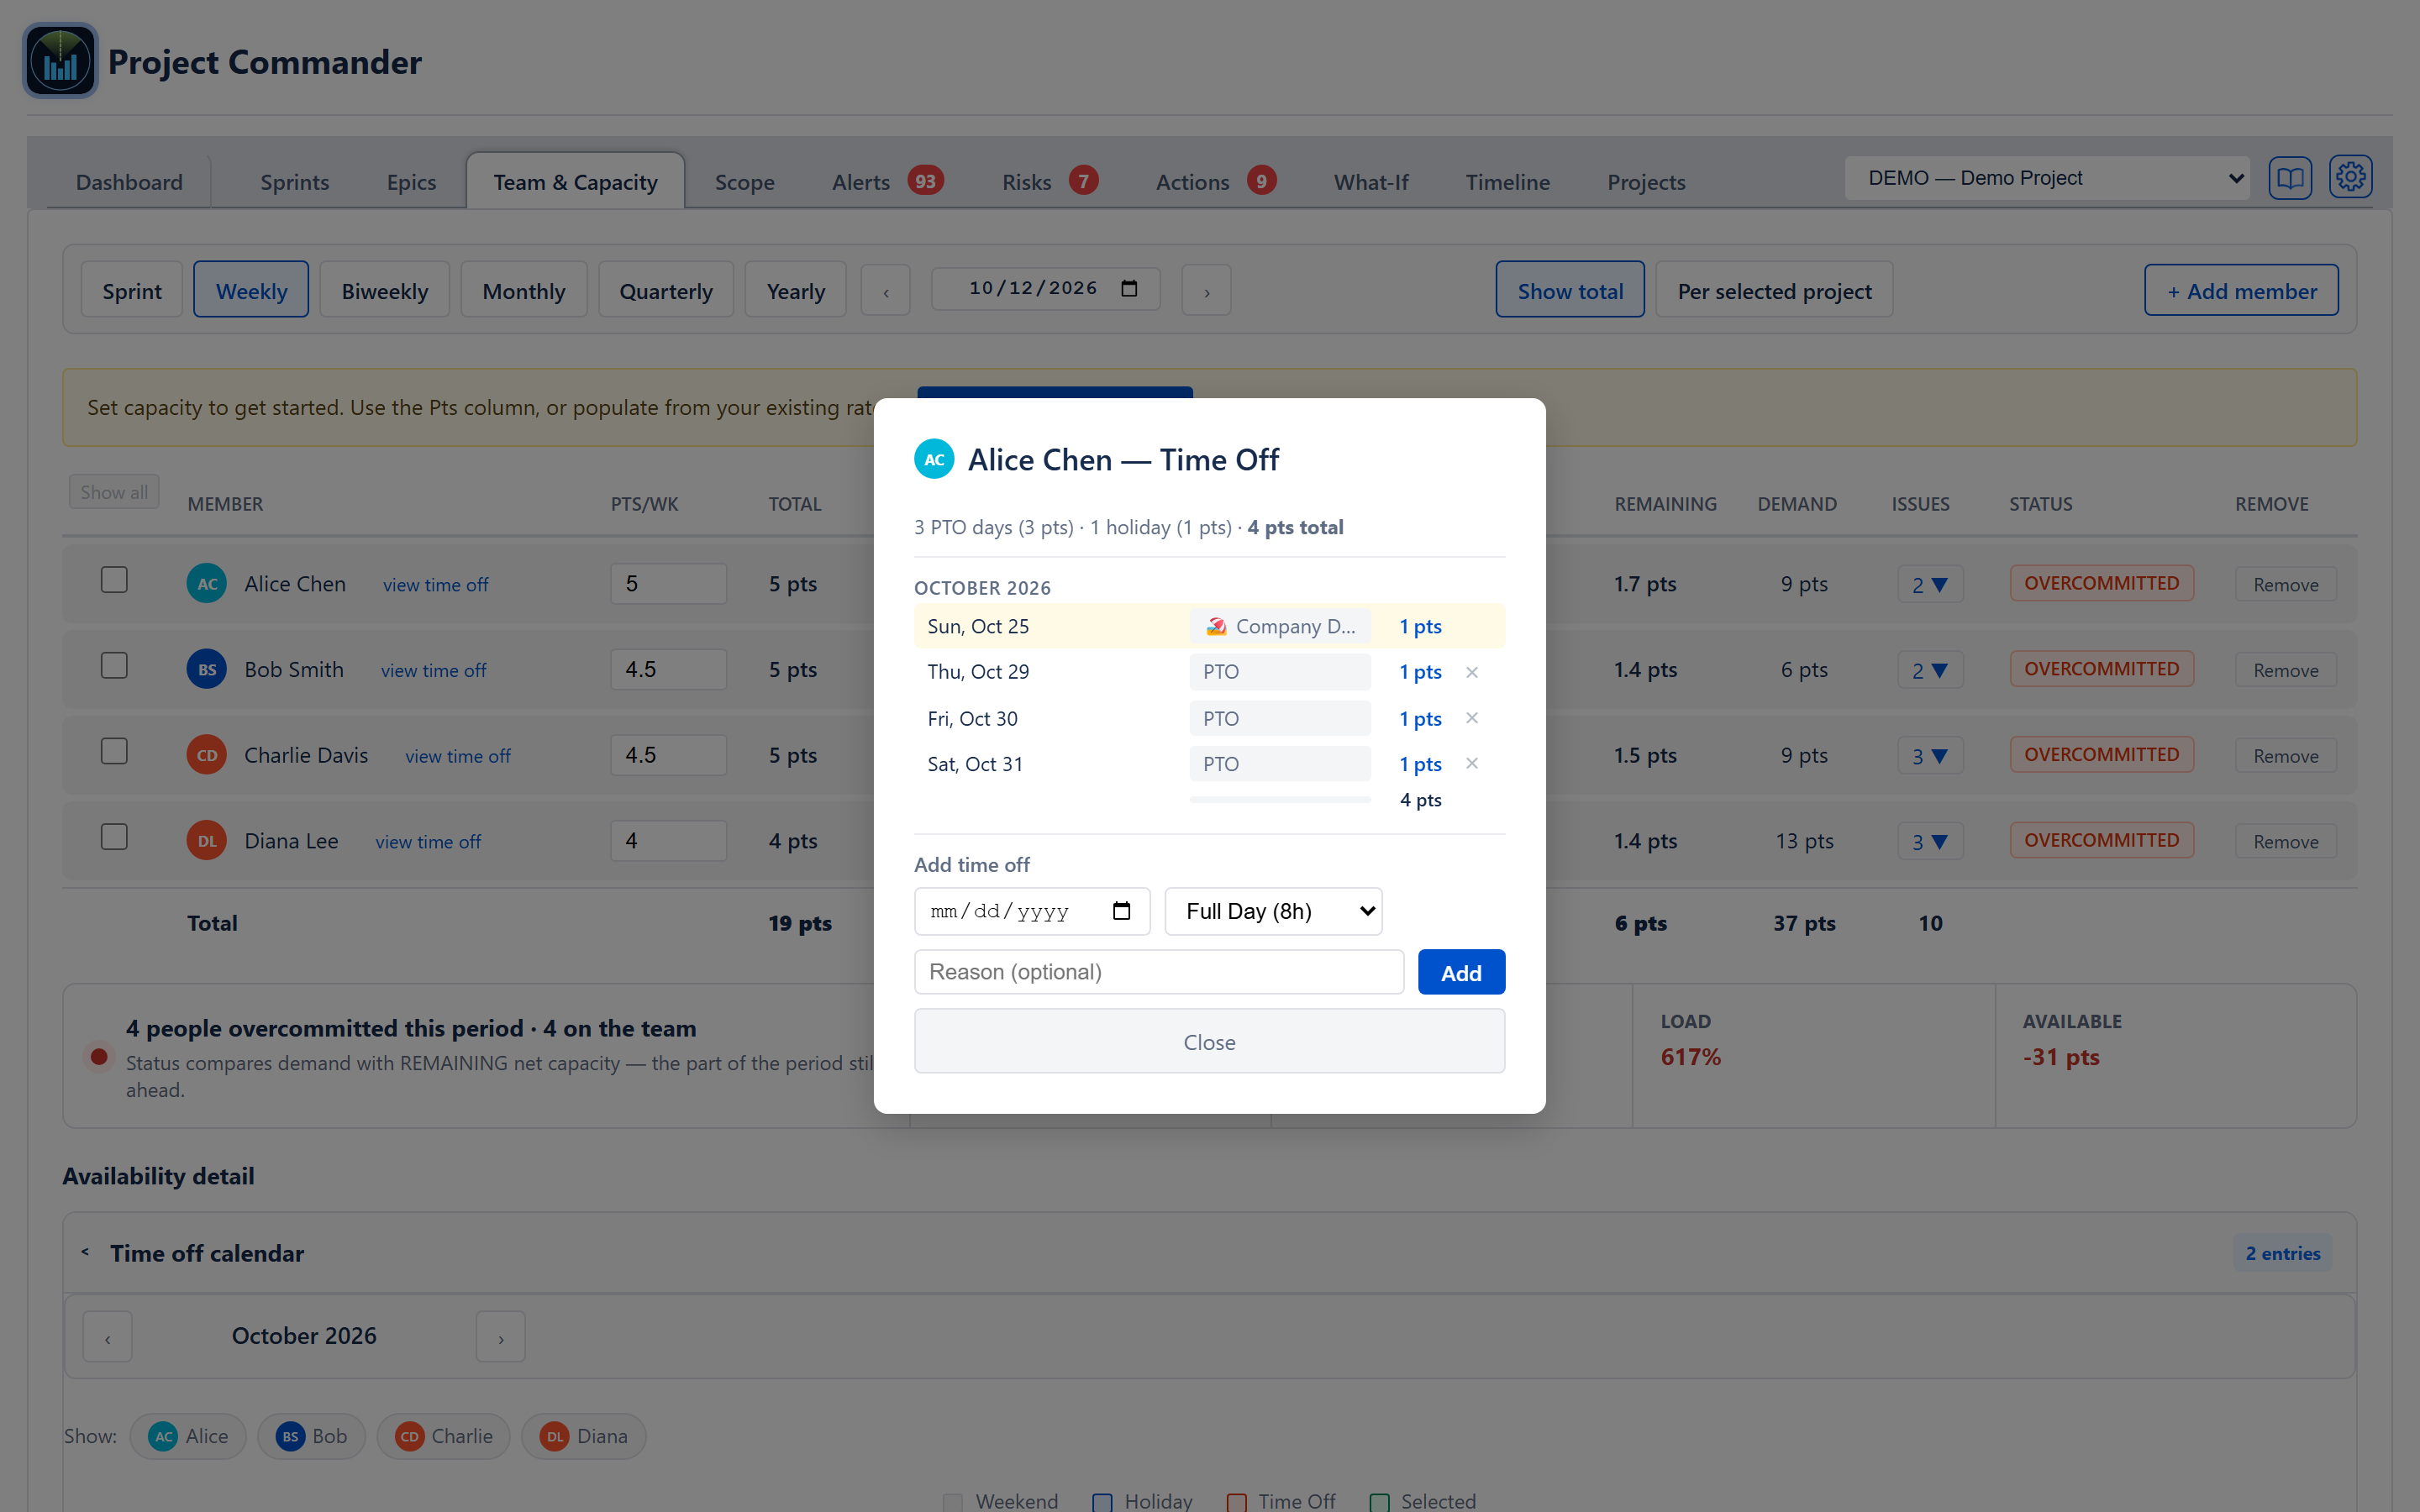
Reached by the view time off link beside the member's name. A dialog over the tab with four parts:
- Header: avatar and <name> — Time Off.
- A summary line: N PTO days (X) · M holidays (Y) · Z total, each figure in hours in a time project (8h) and in points in a points project (2 pts).
- The entries grouped by month (static headings, not collapsible), each listing date, reason, and what it costs, with the month's total at the foot of each group. This lists all of the person's PTO and every company holiday on record, not just the period shown in the table; each holiday is counted at what one day away costs that person, in hours or points as above. PTO entries carry a × button to remove them; holidays do not. With nothing recorded it reads No time off or holidays recorded.
- An Add time off form: a date picker, a duration dropdown (Full Day (8h) / Half Day (4h) / 2h / 1h), an optional reason (Reason (optional)), and an Add button. A second entry on the same date for the same person is ignored. A Close button sits beneath.
Useful for entering a year of PTO upfront or for spotting clashes with a release window.
Time off calendar section
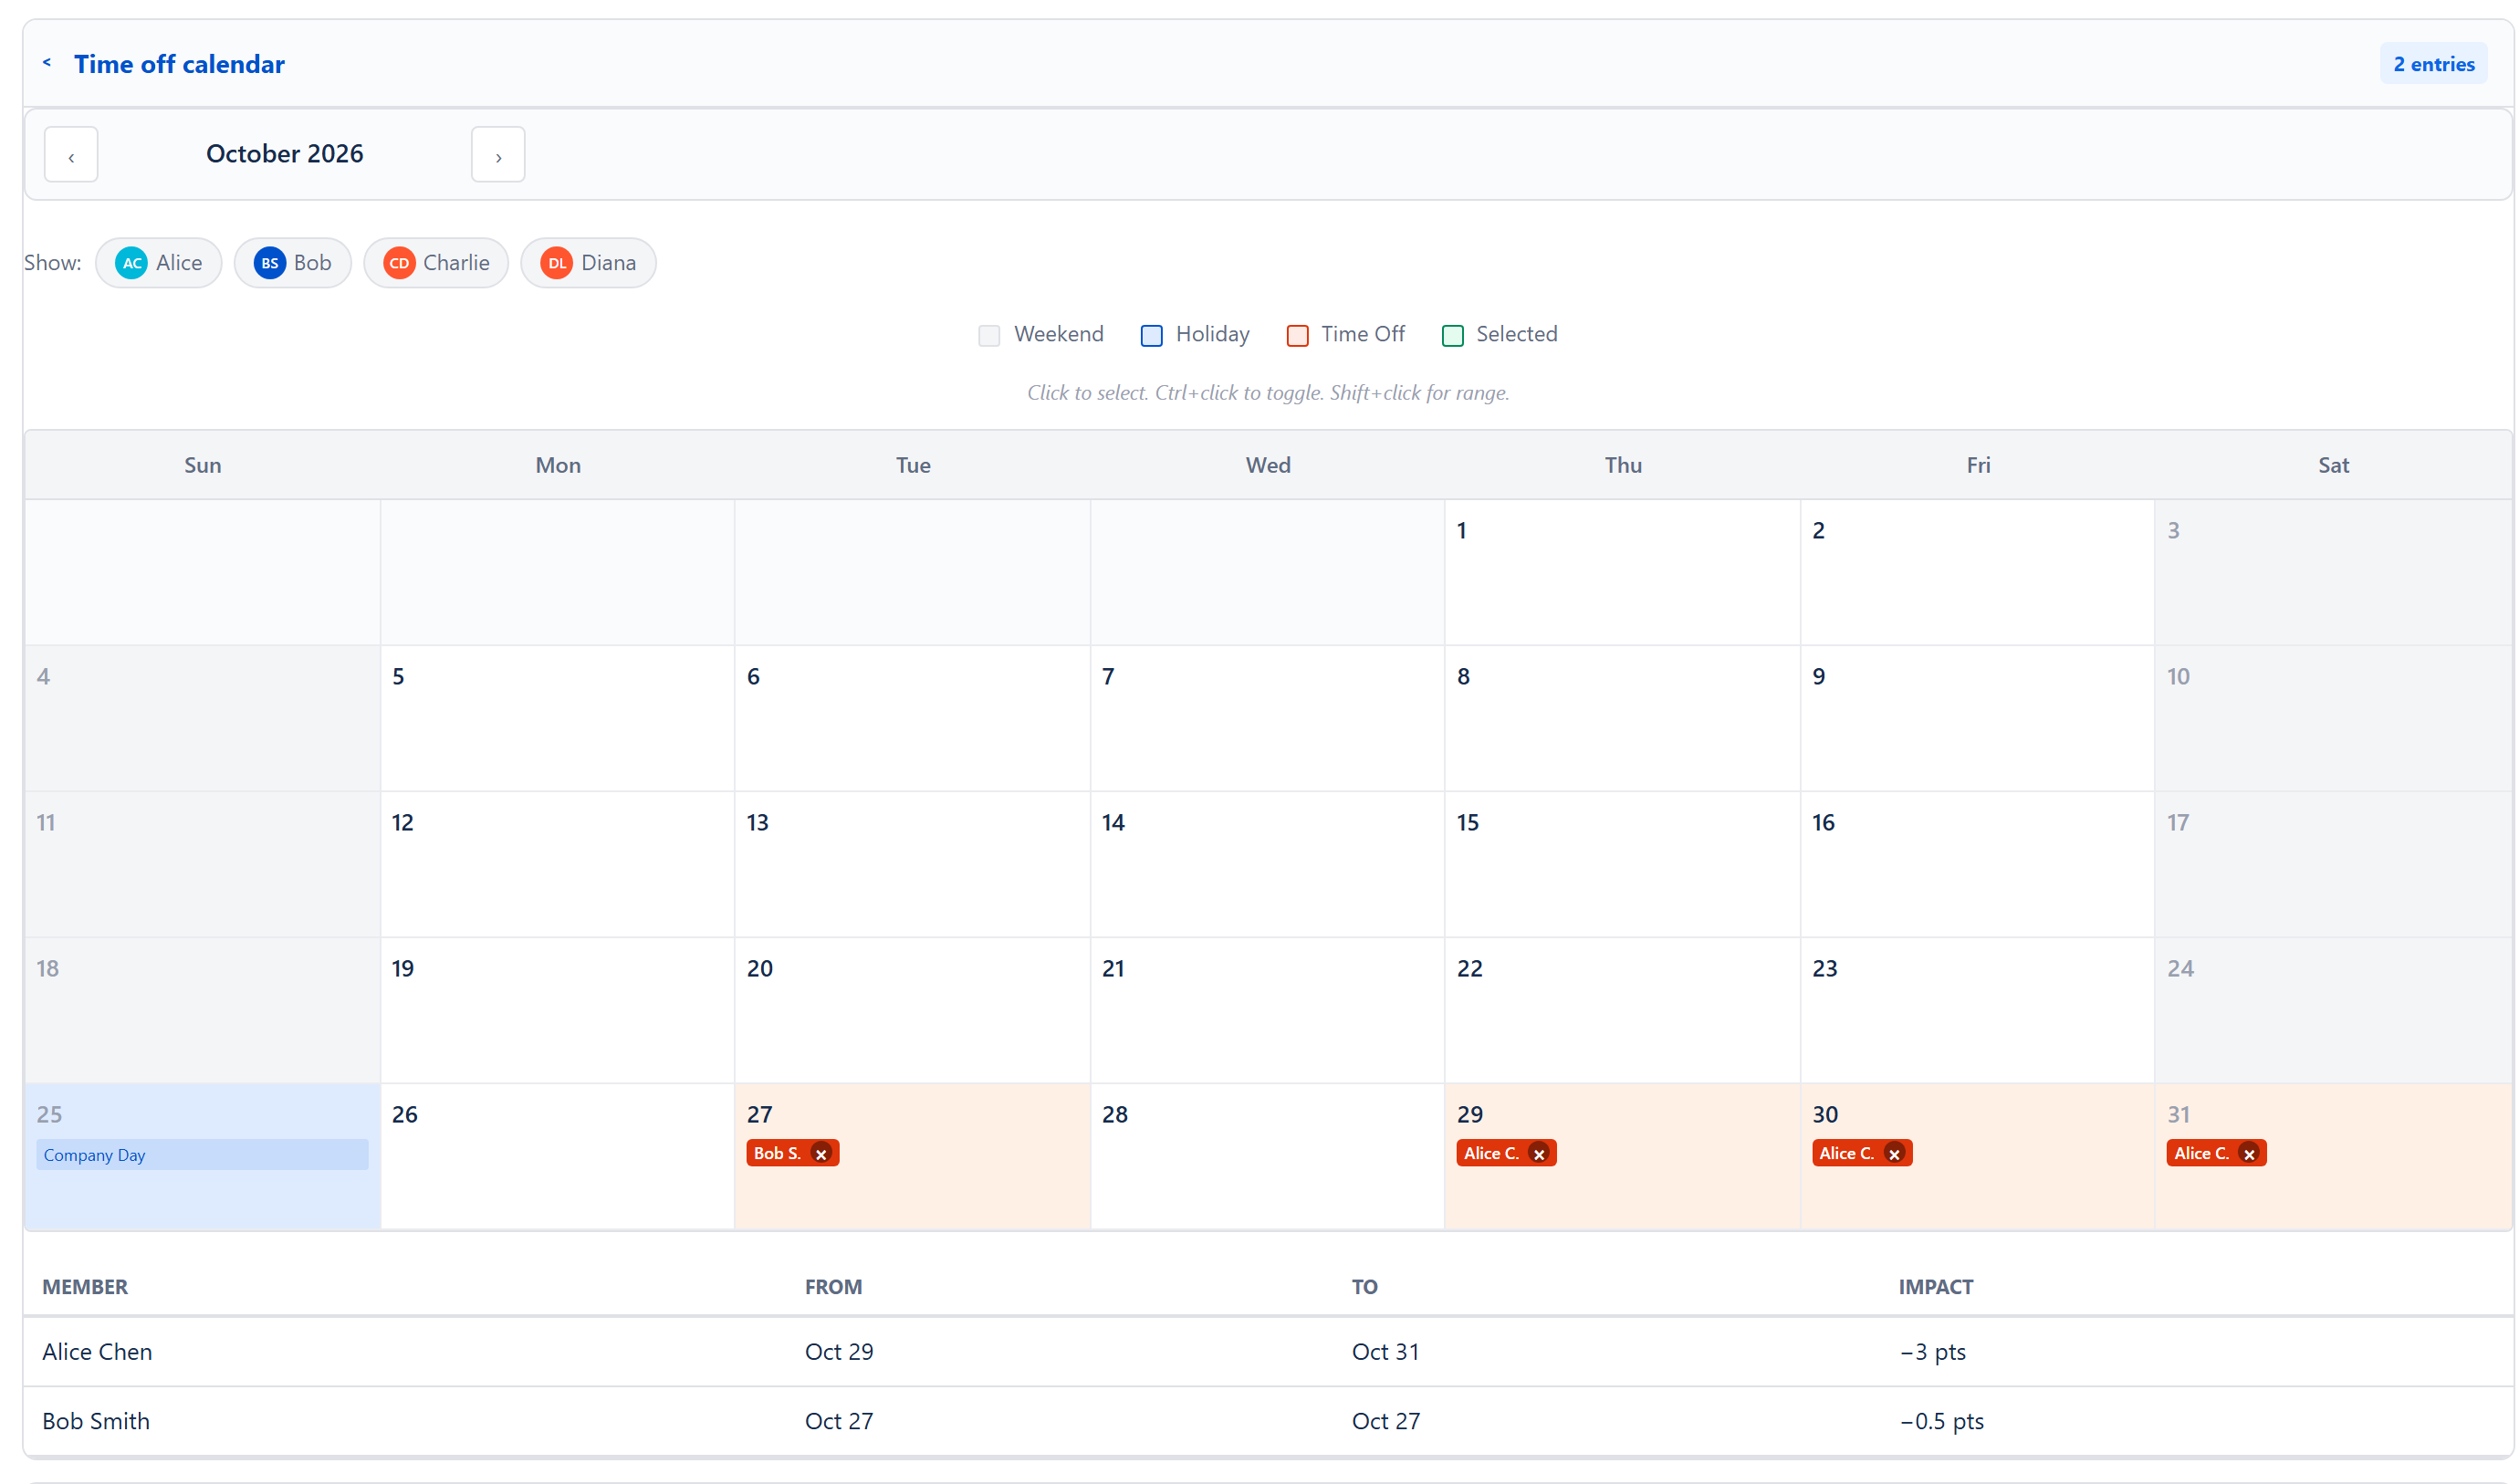
A folding section beneath the summary strip, under the Availability detail heading, named Time off calendar, closed when the tab loads. Its header carries the number of rows in the time off list beneath the calendar (0 entries) — the same month and member filter, with consecutive days for one person counted once. It contains a month-view calendar, controls for multi-day time-off entry, and that list.
Calendar navigation
Its own month bar with left/right arrows either side of the month name; the calendar's month is independent of the team table's period. Useful for editing forward time off while reading current-quarter capacity.
Member filter
A Show: row of chips, one per team member (avatar and first name), letting the user filter the calendar and the list to one or more members. A Clear button appears while any chip is ticked and resets to all members.
Legend
Four day colours: Weekend (light grey), Holiday (light blue), Time Off (pale orange), Selected (light green with a green outline). Beneath it, the line Click to select. Ctrl+click to toggle. Shift+click for range.
Day selection
Click a weekday to select it. Ctrl-click toggles a day in or out of the selection. Shift-click selects a range from the last clicked day to the current day, skipping weekends (Shift+Ctrl adds the range to the current selection). While days are selected, a bar reads N days selected with up to three buttons: Add time off (opens the dialog below), Delete time off (N) (shown only when the selected days hold entries; it removes every PTO entry on those days, for everyone), and Clear (deselects). Each person's time off drawn on a day also carries its own × button to delete that one entry.
Add time off dialog
Opened from Add time off in the selection bar. Its heading is the full date for one day, or N Days Selected with the date range for several; several days are also shown as chips, with an H badge on any day that already has a company holiday. The Add time off section (headed Add time off (N work days) with several days) has a Team Member dropdown, an Hours per day dropdown (Full Day (8h), Half Day (4h), 2 hours, 1 hour), a Reason field, and an Add time off button (Add time off for N days with several days). Days that are already company holidays, or already hold time off for that person, are skipped. For a single day, any existing time off is listed with Remove buttons, and an existing holiday is shown with a Remove holiday button. A + Mark as Company Holiday button opens a small form (name, Add, Cancel) for declaring the same days a holiday — shown unless every selected day already has a company holiday. Close shuts the dialog.
Time off list
Beneath the calendar, a four-column list of exactly what the calendar above is showing — same month, same member filter: Member, From, To, Impact. Consecutive days for one person are gathered into a single row, so a three-day absence reads as one line rather than three.
Impact is what that absence takes off the person's capacity, in the project's own unit, using the same deduction the Net column applies: hours in a time project (days when the project counts in days), and in a points project the member's daily points — their weekly points divided by five — for each day off, with booked hours turned into days at eight hours to the day. It is never raw hours subtracted from a points figure.
When the month holds no time off, the list reads No time off booked this month.
Company holidays section

A folding section beneath the time off calendar, named Company holidays, closed when the tab loads; its header carries the number of holidays (1 holiday). Each row shows the date (formatted as Jan 1), the name, a 🔄 mark for yearly holidays, and Edit / Delete buttons. The Edit button switches the row into inline edit mode (date input, name input, Yearly checkbox, Save / Cancel). The Delete button removes the holiday immediately. The add row at the bottom takes a date, a name (Holiday name), and a Yearly checkbox; its Add button is greyed out until both date and name are filled. A second holiday on a date that already has one is ignored.
Holidays apply company-wide and are taken off every member's net capacity automatically.
Total row
The last row of the team table adds up the whole roster — it does not change when the table is filtered to one member.
- Total — period capacity sum.
- Util % — capacity-weighted average of utilisation.
- Time Off — what PTO plus holidays take off across the team, in the same unit as the column above it; hovering over it splits the figure into holidays and PTO.
- Net — total capacity after deductions.
- Remaining — the same, over the part of the period still ahead.
- Demand — total not-done work in the period, including work assigned to people who are not on the roster.
- Issues — total issue count across the same issues the Demand total covers.
Every figure sits under its own heading, including when the Alloc column is present.
With Per selected project on, Total, Net and Remaining are scaled by each member's allocation; time off, holidays and demand totals stay unscaled.
Demand-vs-Capacity feed (no chart in this tab)
The Team & Capacity tab itself does not draw a demand-versus-capacity chart. The same data feeds the Project view on the What-If tab (its week-by-week plan), the Demand vs. Capacity section on the Scope tab, and the capacity figures on the Sprints tab. The link is one-way: configure here, see results elsewhere.
Estimation mode and time units
The whole tab adapts to the project's estimation mode:
- Points mode — the capacity column heading reads Pts/[Period]; capacity and demand are points, written pts.
- Time mode — the heading reads Hrs/[Period]; capacity and demand are written hrs, or days when the project counts time in days. The Time Off column is in hours.
The Time Off column is in hours in a time project and in points in a points project; time off itself is always booked in hours.
Per-week capacity is stored in whichever unit the project is in; switching modes does not convert stored values automatically. The whole roster is filed under the project's board, or under the project key when the project was added with Sprint mode off and has no board (2026-09-05); reading or saving it needs access to that board, or to that project.
Data persistence
Every change saves as soon as it is made — on leaving a field, on a button press, or on confirming a dialog. There is no Save button; a Saving... note shows while a save is under way. The roster, week-by-week capacity, utilisation, time off and holidays are saved as one record: in the Forge app, in the app's own storage, filed under the board or project key; in the connected web app, on the signed-in person's Jira account. Allocations (the Alloc column, the popover and the Share of <project> field) are saved separately, with the list of projects on the Projects tab.
One capacity per person, across every project (16 October 2026, finding 9). A capacity typed for a person on one project's Team & Capacity tab is saved, for the same weeks, for that person on every other registered project they are on that counts in the same unit, so the roster, the Alloc popover and the Projects tab's Team Allocation Matrix show the same figure for them. A project counting in another unit is left alone, because points and time are never converted into one another. If Jira refuses the save on another project, a line beside Saving... names it: Capacity saved here but Jira refused it on IBTG. Figures typed before this date are not changed until the person's capacity is next typed.
Removing a member can unassign that person's open issues in Jira — the only Jira write the tab makes, and only when the user ticks that box in the removal confirmation.
Cross-cutting modes and settings
- Estimation mode — controls units and column headings.
- Sprint mode on/off — when off, the Sprint button reads Period and the capacity heading reads Pts/Period or Hrs/Period.
- Projects ticked Active on the Projects tab — any at all unlocks the Alloc column, the Show total / Per selected project buttons and the allocation popover.
- No project picked in the header — Per selected project is greyed out, because there is no single project to scale capacity by.
How the numbers are computed
- Net capacity formula — see ALGORITHMS Appendix → Capacity and Demand (Net Available Hours, Net Available Points).
- Load bands — see ALGORITHMS Appendix → Utilisation Ratio. Bands: above 115% Overcommitted, 90–115% Optimal, 60–90% Available, below 60% Underloaded — judged against the Remaining column (period clipped to today-forward).
- Allocation factor — see the ALGORITHMS Project Allocation section (Per-Member Allocation Factor, and Allocation in Scenarios and Cascades).
- Weekly bucketing — ALGORITHMS section 5 (Weekly Capacity Bucketing).
- Partial weeks — see ALGORITHMS Foundation Utilities → ISO Week Conversion for how partial weeks are handled.
Effects on other parts of the app
- Delivery Forecast card (Dashboard, Scope, What-If) — the Team capacity and Effective team capacity models read each person's capacity, utilisation and time off from this tab.
- The Project view on the What-If tab, and the Demand vs. Capacity section on the Scope tab — read holidays, PTO, weekly capacity and demand.
- Auto-Level — per-person capacity caps configured here keep each person within their limit when Auto-Level balances work. (One balancing strategy that respects these per-person caps exists in the engine but is not shown in the Auto-Level menu and is not auto-selected; see ALGORITHMS §6.)
- Sprints tab — the sprint card's capacity (Demand vs Capacity, Deliverable / Tight / Overcommitted) is worked out from the same weekly values for the sprint's dates.
- Projects tab — the Team Allocation Matrix shows the same allocations as the Alloc column. The matrix cannot be edited; allocations are changed here, in the Alloc column.
- Risks tab — none of the suggestions under Suggested by the app read this tab's capacity or time off directly. Project deadline at risk compares the delivery forecast with the target date, so capacity typed here reaches it only through that forecast; the suggestion that one person is carrying most of a sprint's load reads each sprint's issues; Velocity declining reads sprint history; and the time-off suggestion looks for time off in a form this tab does not record, so time off booked here does not raise it.