 Project Commander Docs
← Back to site
Project Commander Docs
← Back to site
Sprints Tab — Feature Guide
What it’s for
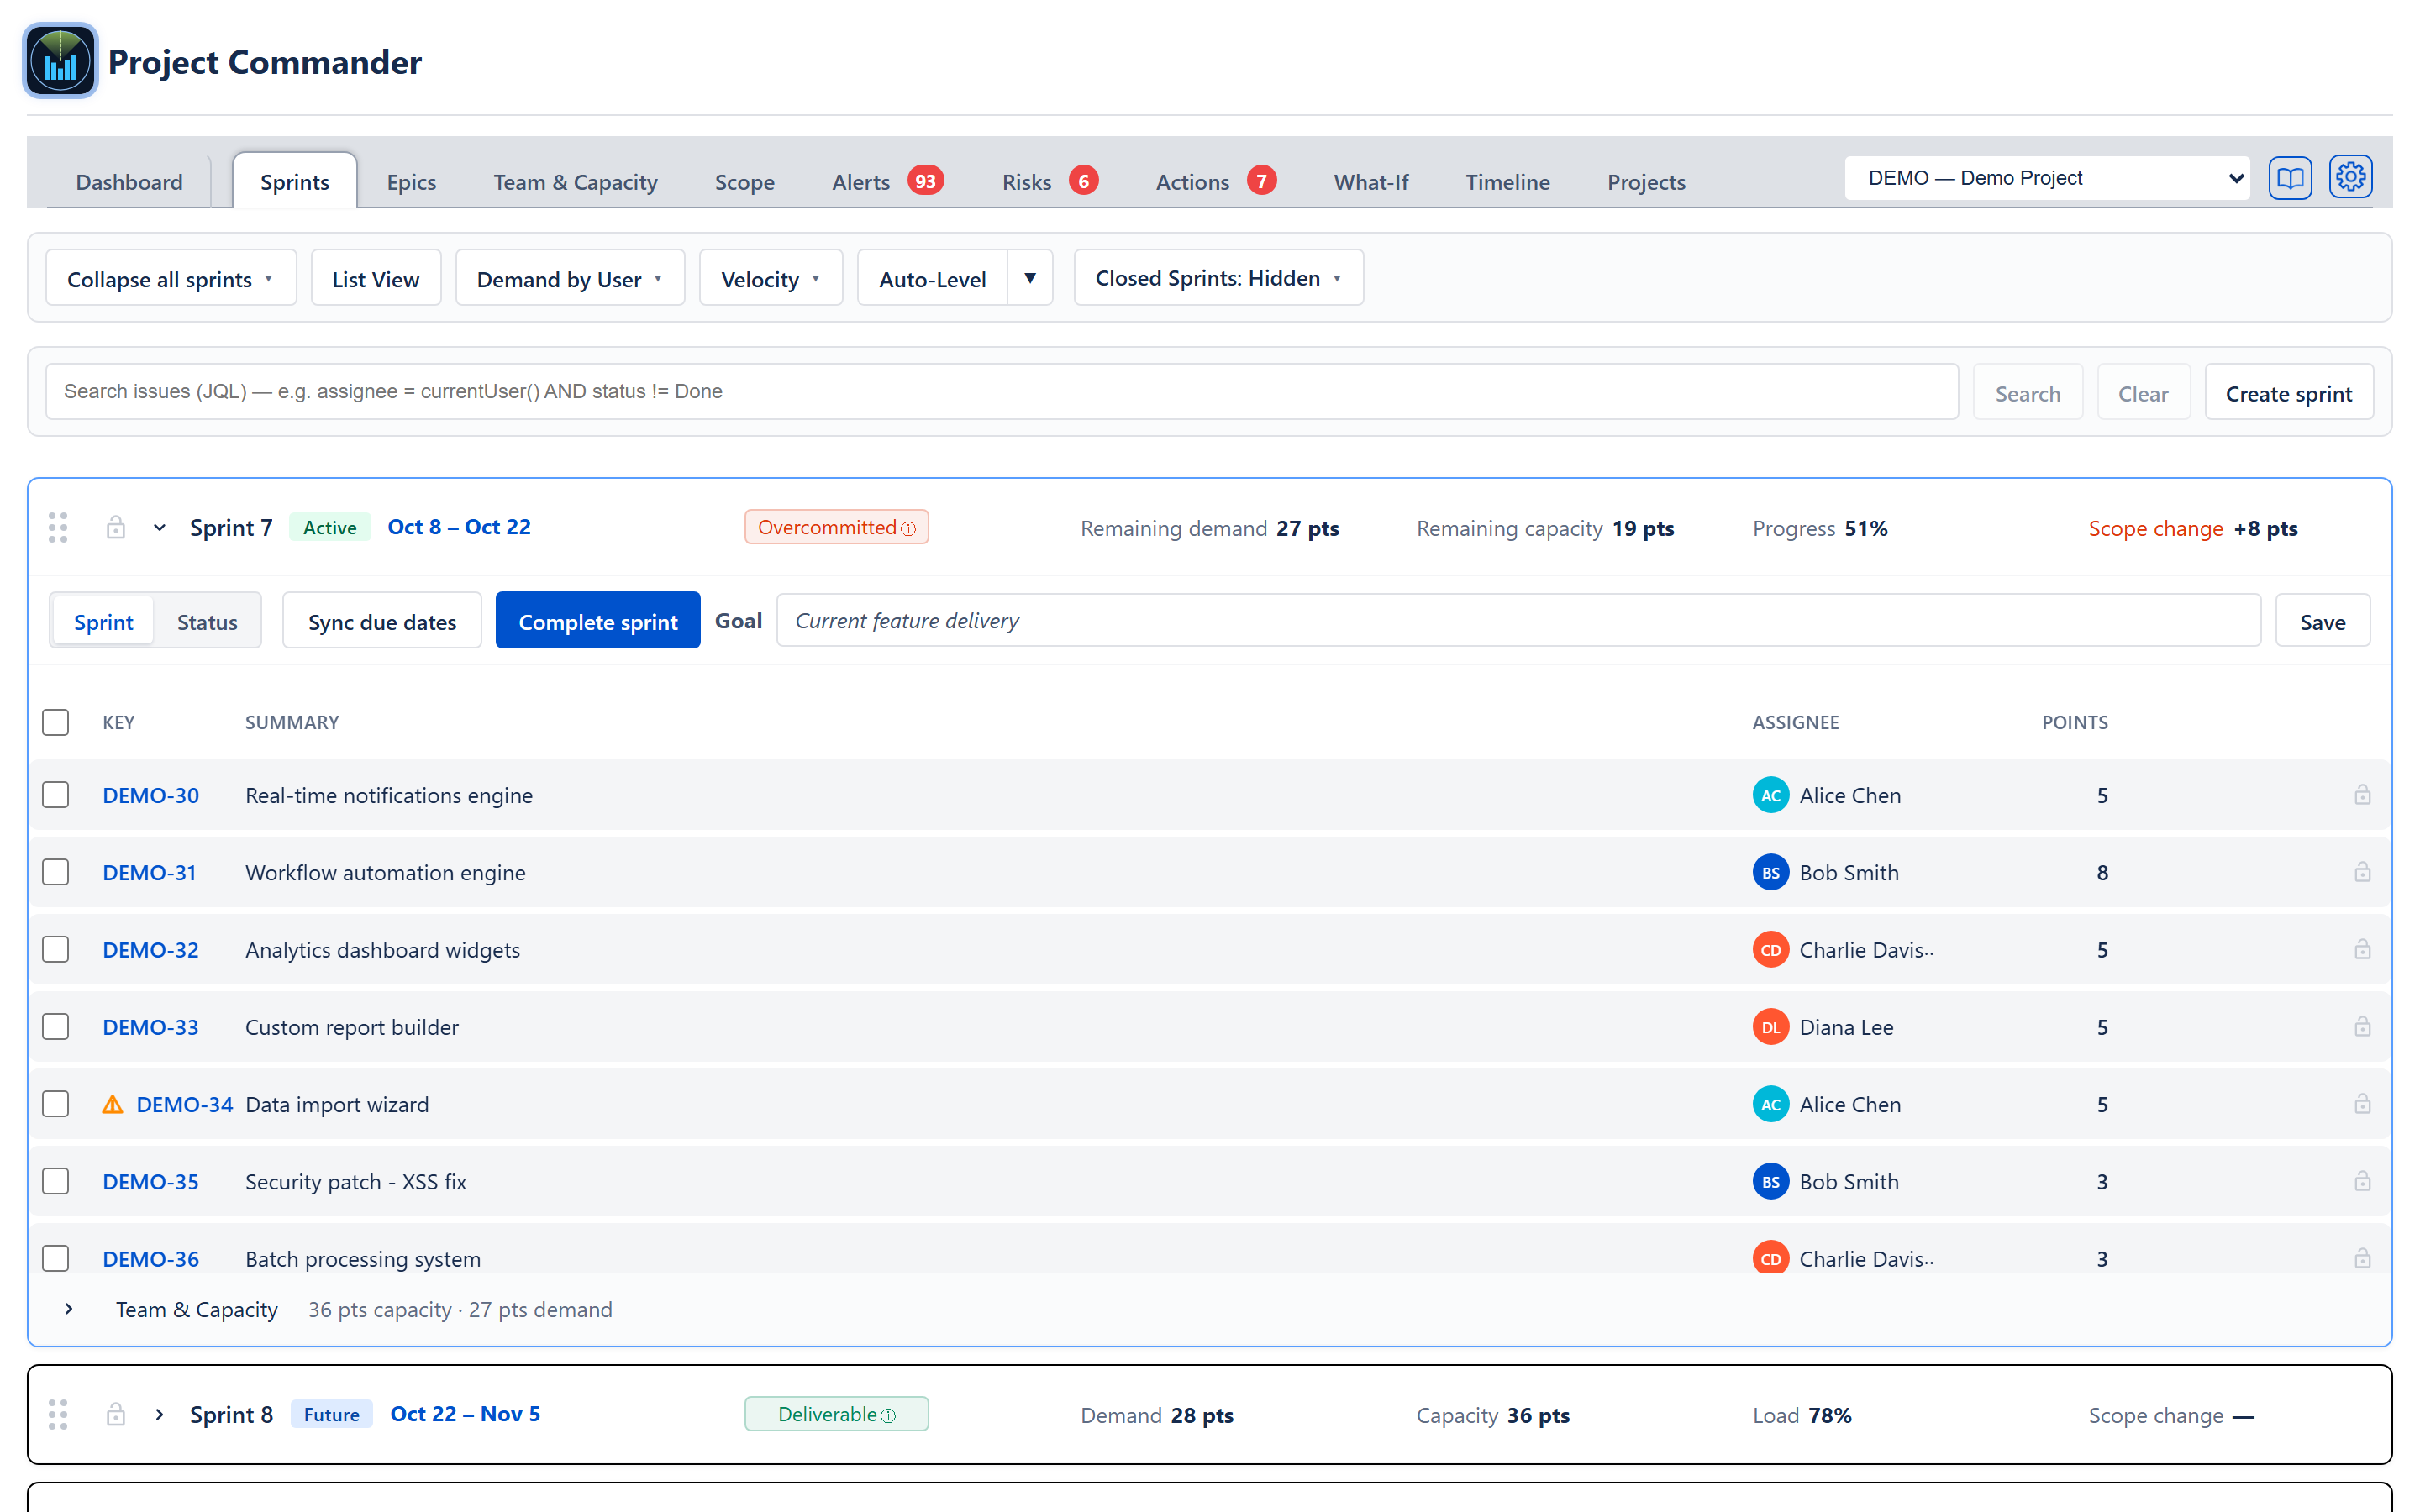
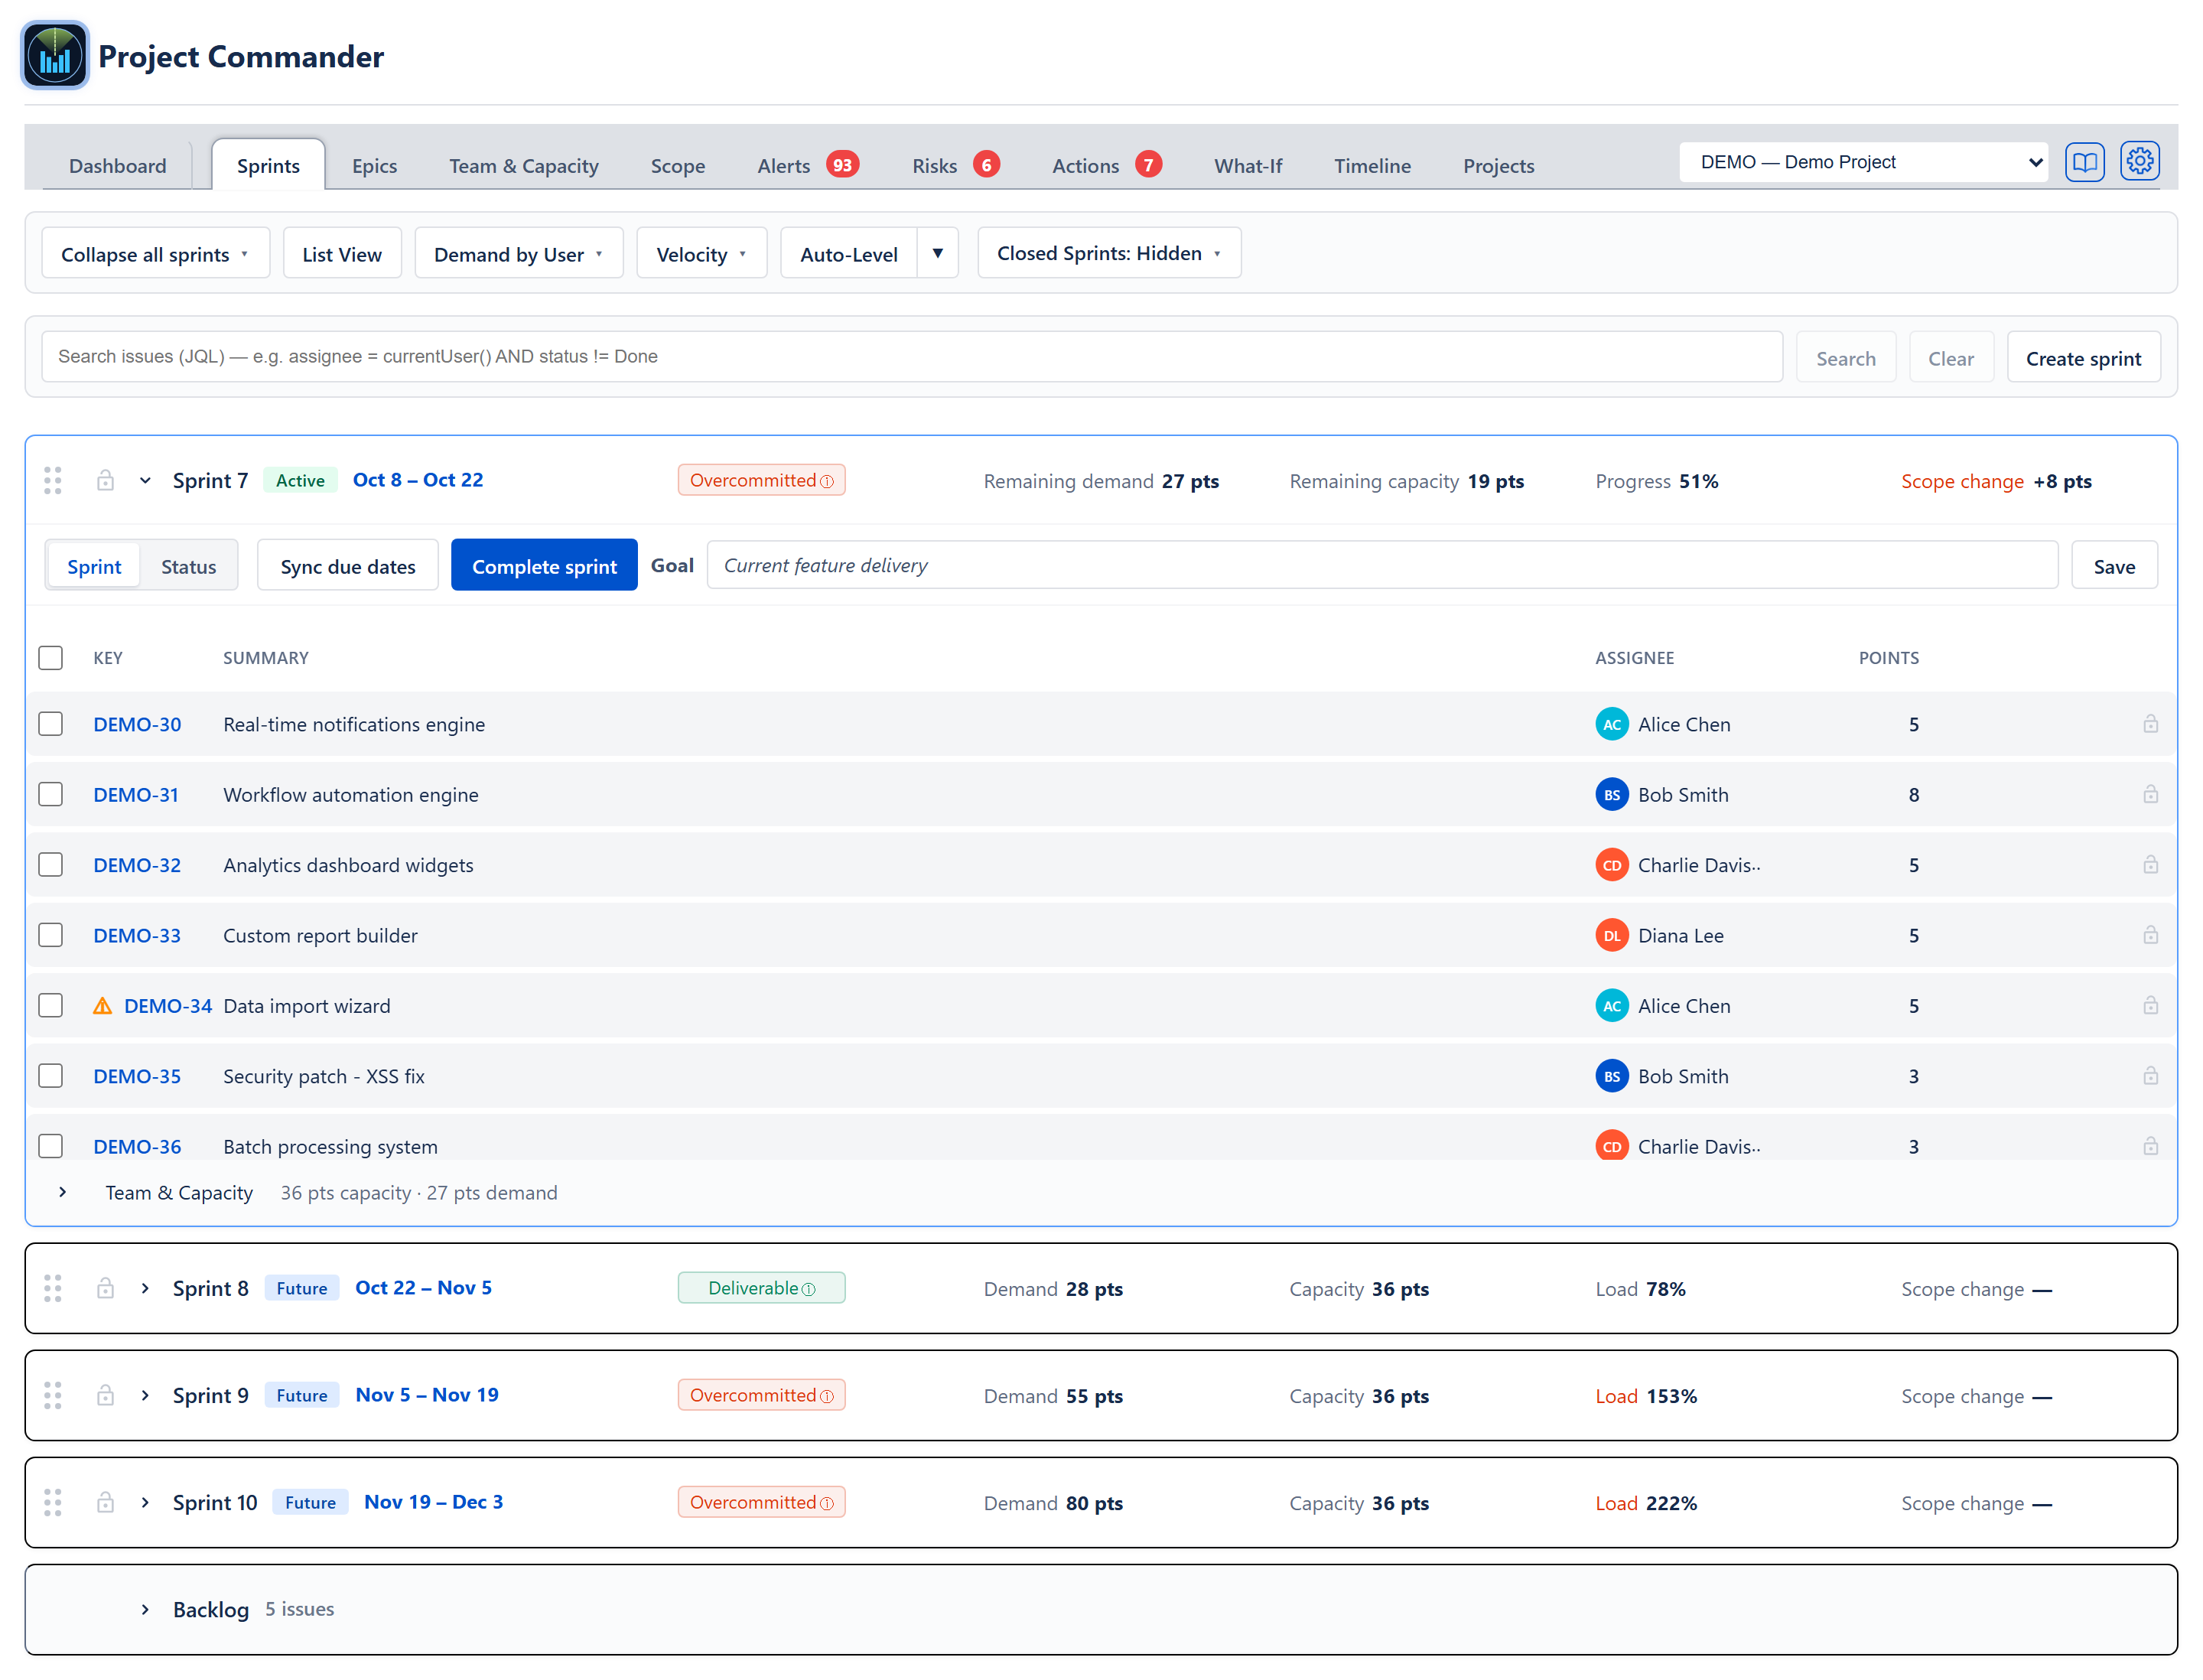
The Sprints tab is the single execution view for a project’s sprint cadence. It combines sprint planning, retrospectives, status, and risk analysis into one stack of expandable sprint rows plus a backlog row. From here a planner can:
- See commitment versus capacity for every active and future sprint at a glance.
- Drag work between sprints and into or out of the backlog.
- Lock issues or whole sprints in place.
- Run automated rebalancing across sprints.
- Start, complete, and delete sprints, including roll-over of unfinished work.
- Switch any row between a forward-looking Sprint view and a Status or Retro view.
The tab is strictly per-project. When the project picker in the tab bar is set to Program view (offered when more than one project is registered), the tab is replaced with a notice headed Pick a specific project to view the Sprints tab, because sprint cadences from different projects cannot be summed.
With the project's Sprint Mode checkbox turned off (Projects tab, Add / Edit Project form), the tab is named Tasks instead, the toolbar is not shown, and the issues are listed in one card named Tasks.
Toolbar

A single row at the top of the tab. Left to right: Collapse all sprints, List View, Demand by User, Velocity, Auto-Level, and the Closed Sprints dropdown. The issue search, Create sprint and Create Issue sit on the row beneath it (see JQL Search).
Collapse all sprints / Expand all sprints
Toggles every sprint row plus the backlog open or closed at once. The label flips to Expand all sprints when everything is already closed.
Which sprints start open: only the active one. Every future and closed sprint starts closed, and the backlog starts closed too — unless the backlog is the only card on the screen (a board with no sprints, or task-list mode), in which case it starts open so the tab is not one shut header. Once a row has been opened or closed by hand, that choice is remembered and the default no longer applies.
List View / Sprint View
List View replaces the per-sprint cards with a single searchable, sortable table of every issue across the sprints on screen plus the backlog. The first column is Sprint (the backlog's issues read Backlog), and the table opens sorted by it. The search box reads Search N issues… and filters across key, summary, assignee, sprint name, and status, with an N of M count beside it. Click any column heading to sort ascending; click again for descending. The other columns follow the Display Columns list in the Settings gear; when none are ticked, Key, Summary, Assignee and Points are shown. List View has its own Create Issue button, hidden in read-only mode. The button reads Sprint View while the list is showing.
Demand by User
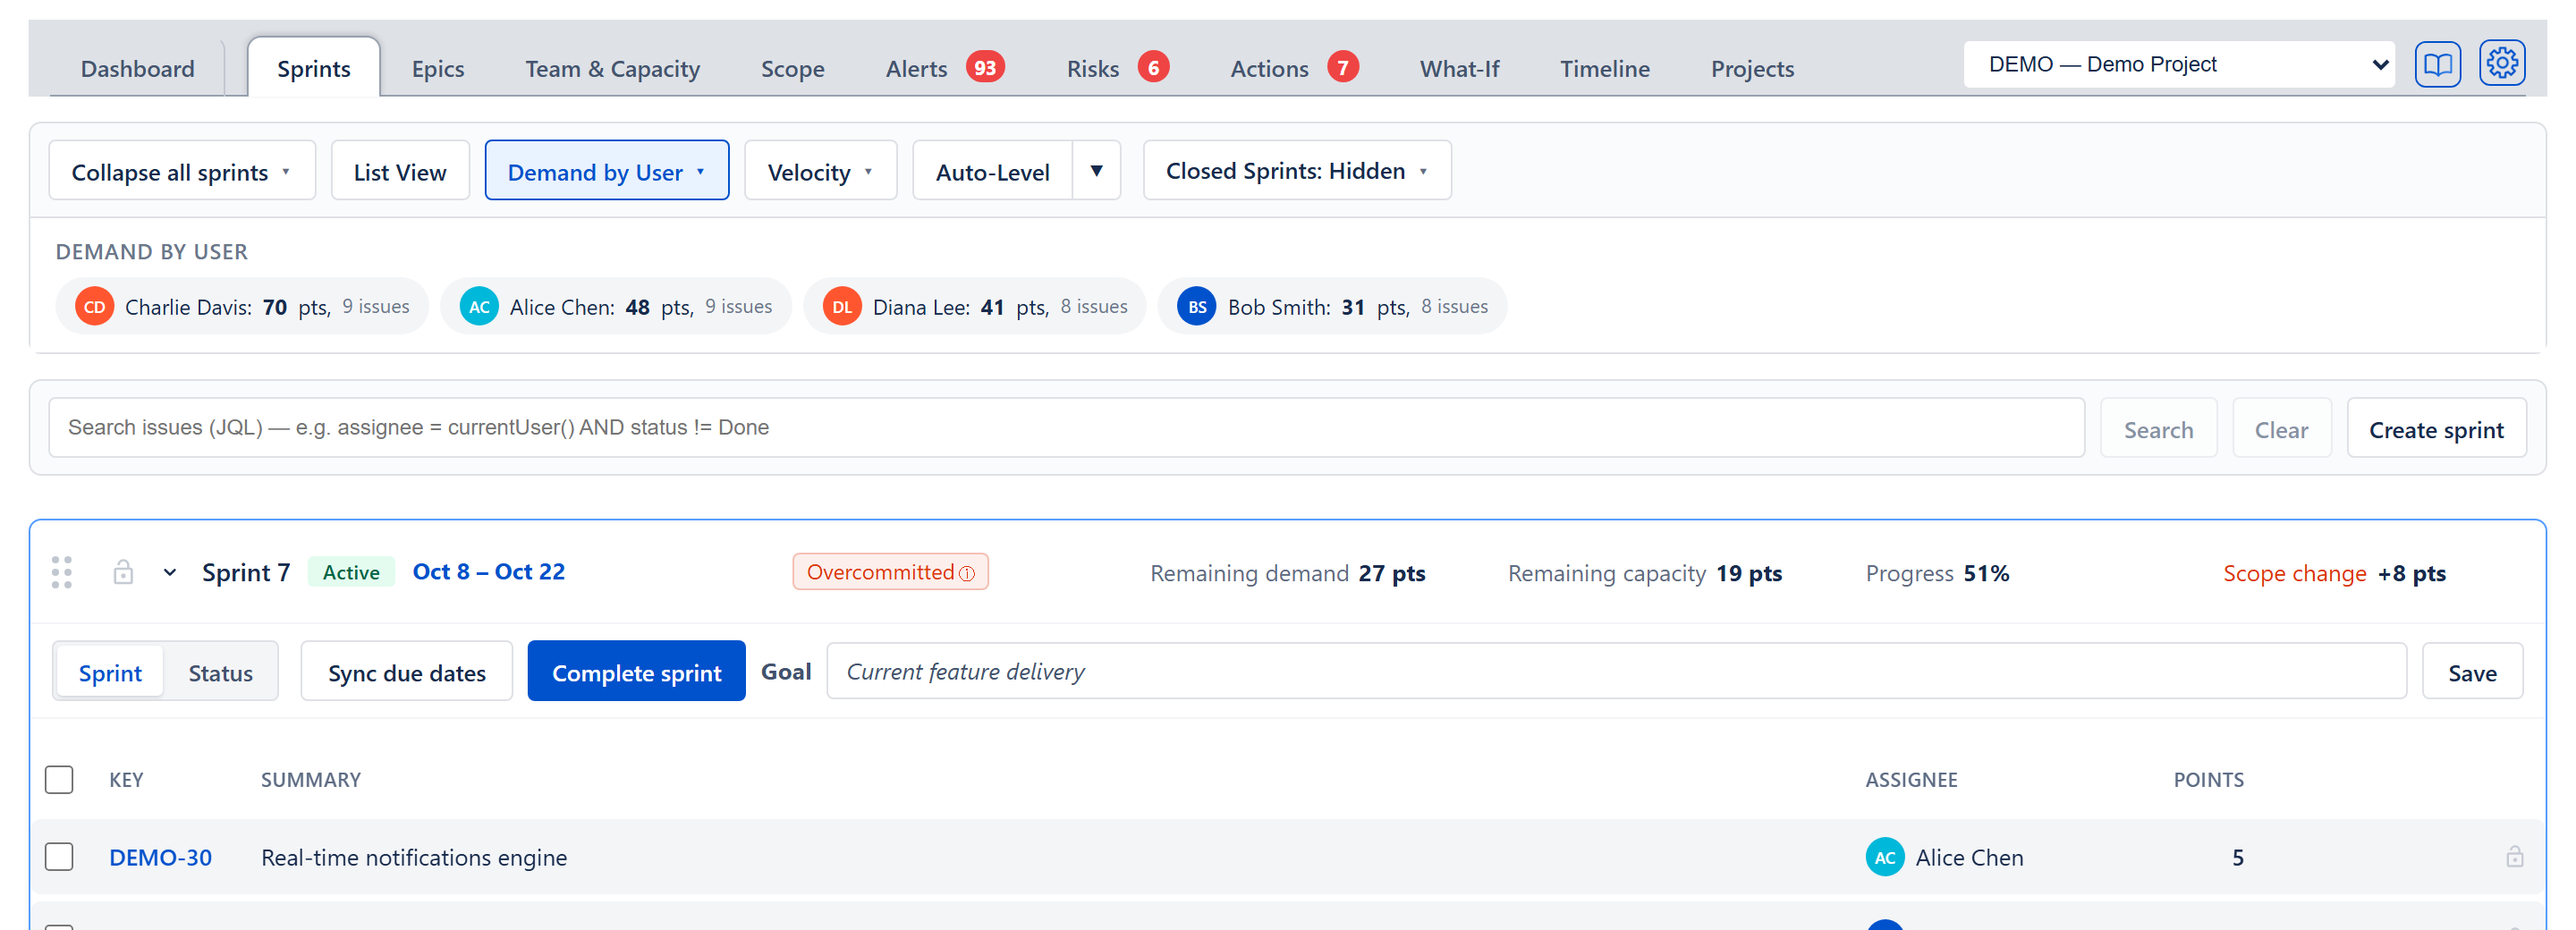
Appears when at least one issue has an assignee. Opens a panel headed Demand by User with one chip per person, largest first, reading for example Charlie Davis: 70 pts, 9 issues: the work not yet done that the person has across the sprints (backlog issues are not counted), sized in time projects by the project's Remaining Work setting. Clicking a chip narrows the sprint cards and the backlog on this tab to that person's issues. While a chip is chosen, each sprint header's demand is that person's work alone, but its capacity is still the whole team's, so a sprint can read Deliverable for one person that is overcommitted for the team; the card's own verdict for the team is back the moment the chip is cleared. Clicking the same chip again clears the filter. The filter applies to this tab only.
Velocity
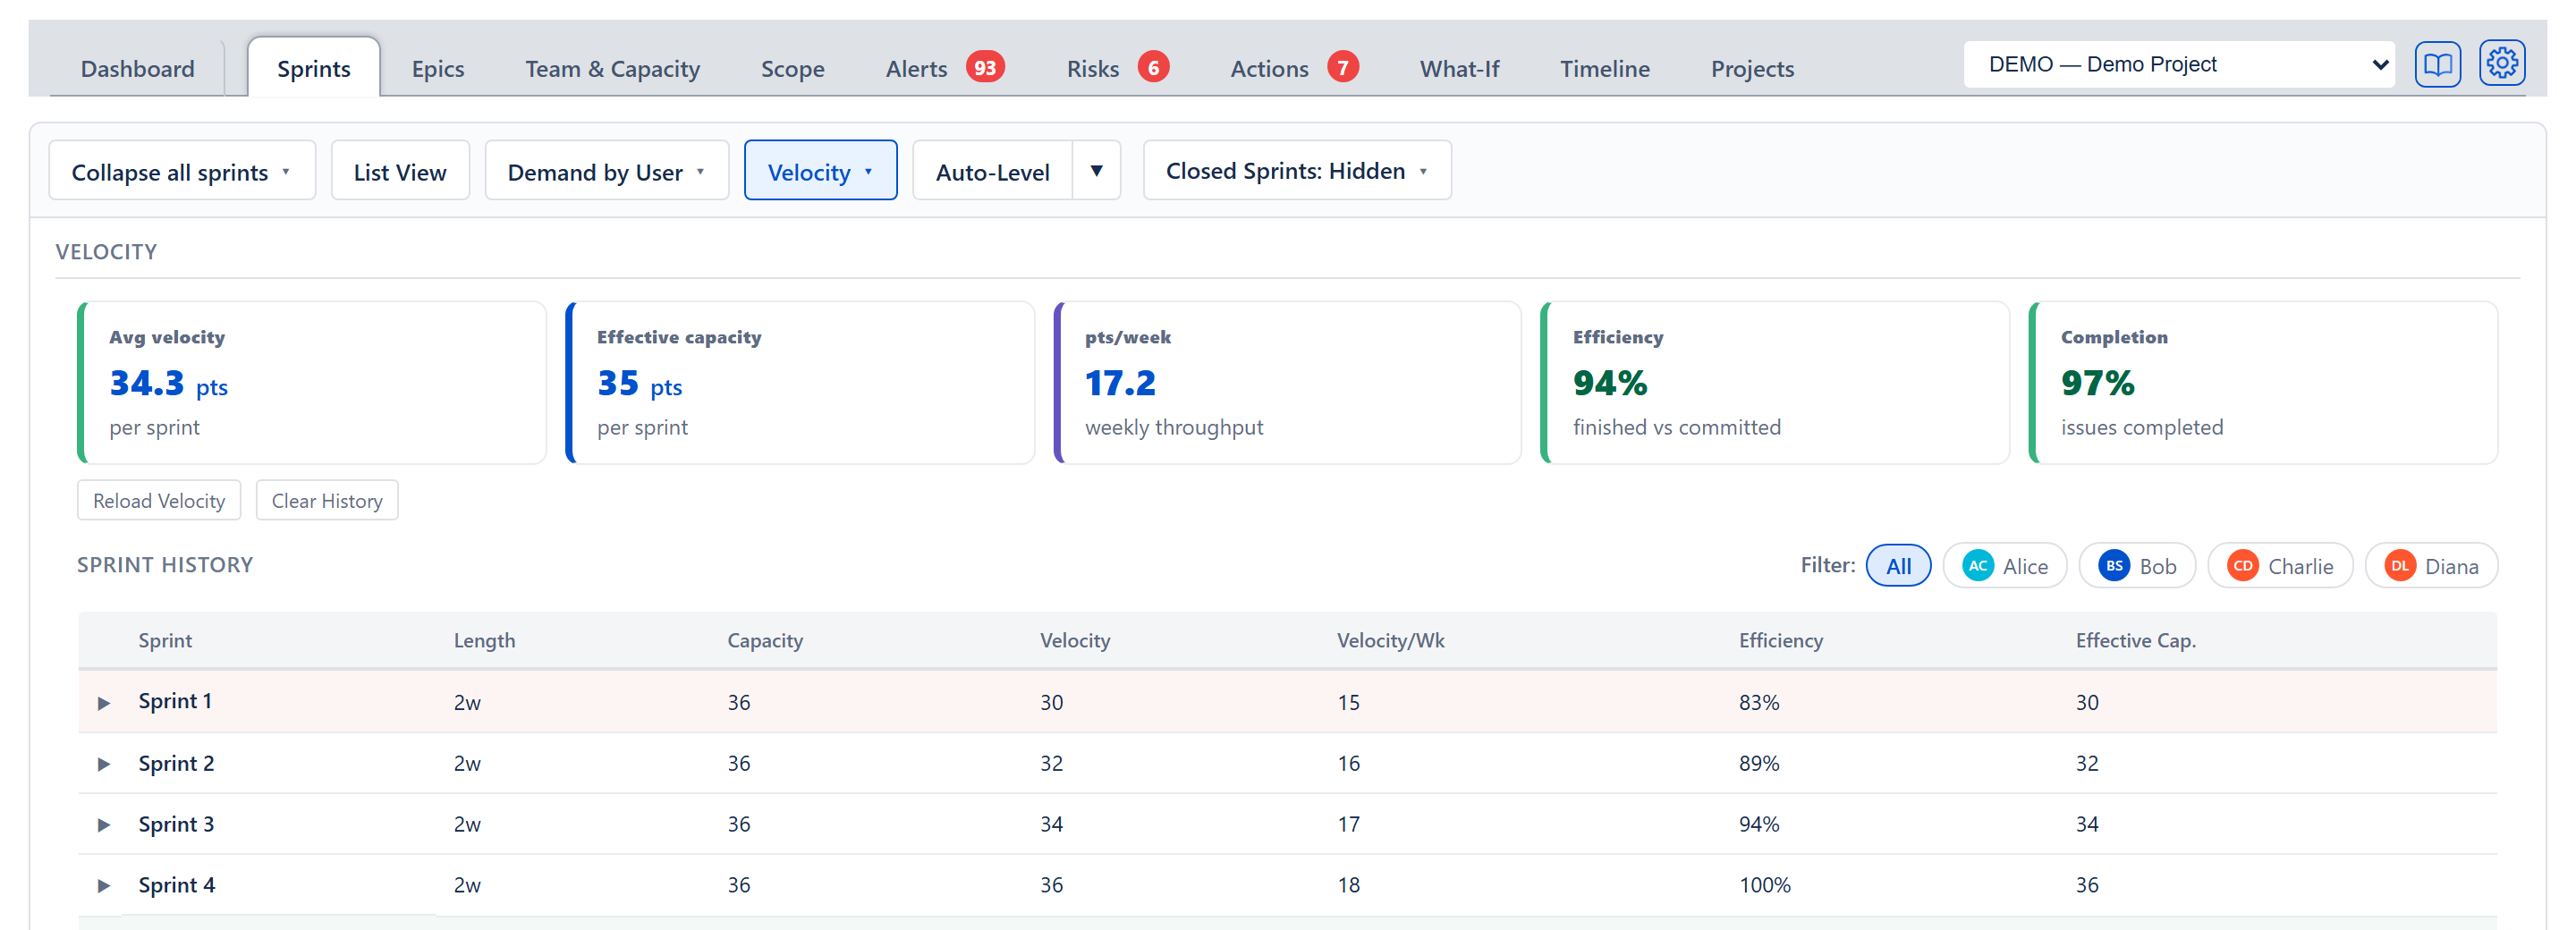
Opens an inline panel headed Velocity containing:
- Five summary cards: Avg velocity (per sprint), Effective capacity (per sprint), pts/week (or hrs/week, weekly throughput), Efficiency (finished vs committed), and Completion (the share of issues completed). The effective-capacity card normally reads sprint capacity × measured efficiency; when no efficiency has been measured it falls back to average-per-week × sprint length and says so on the card (avg/week × weeks — no measured efficiency).
- Reload Velocity (refetches the latest history from Jira) and Clear History buttons. Clear History asks first, in a dialog headed Clear velocity history?.
- A Sprint History table for closed sprints with Sprint, Length, Capacity, Velocity (the work completed in the sprint), Velocity/Wk (that work divided by the sprint's length in weeks), Efficiency, and Effective Cap. — the two velocity columns were headed Completed and pts/Wk until 2026-09-13, so nobody scanning the table for velocity found it. Each row expands to a per-issue table (Status, Key, Summary, Assignee, size, and Flags) for that sprint.
- Filter: chips beside the Sprint History heading — All, then one per person by first name — to view the history for the whole team or chosen people.
- A Lookback: dropdown — Last 3, 5, 8 or 10 sprints. It is the project's setting and is used by every tab.
- An amber notice when the history was recorded in a different estimation mode or time unit from the project's current one.
- The panel reads velocity from every sprint that has closed on the board (26 September 2026): the sprints the app completed itself, whose figures it captured in detail at the time, and every other closed sprint read from Jira, counted by the same rule as a closed sprint's header (work carried out of a sprint is planned there, not delivered there). So the connected web app, which completes no sprints, shows velocity too. The empty state reads Close a sprint to start tracking velocity. with Velocity is read from every sprint that has closed on this board, and captured in more detail when you complete a sprint here. beneath it. An Import from Completed Sprints button appears only in the empty state, for bringing in historical velocity data in the app installed in Jira. The outcome is shown next to the button after the click — in green, Imported N sprint(s) from history (or Import complete), or in red, Import failed: … with the reason.
Auto-Level (split button)
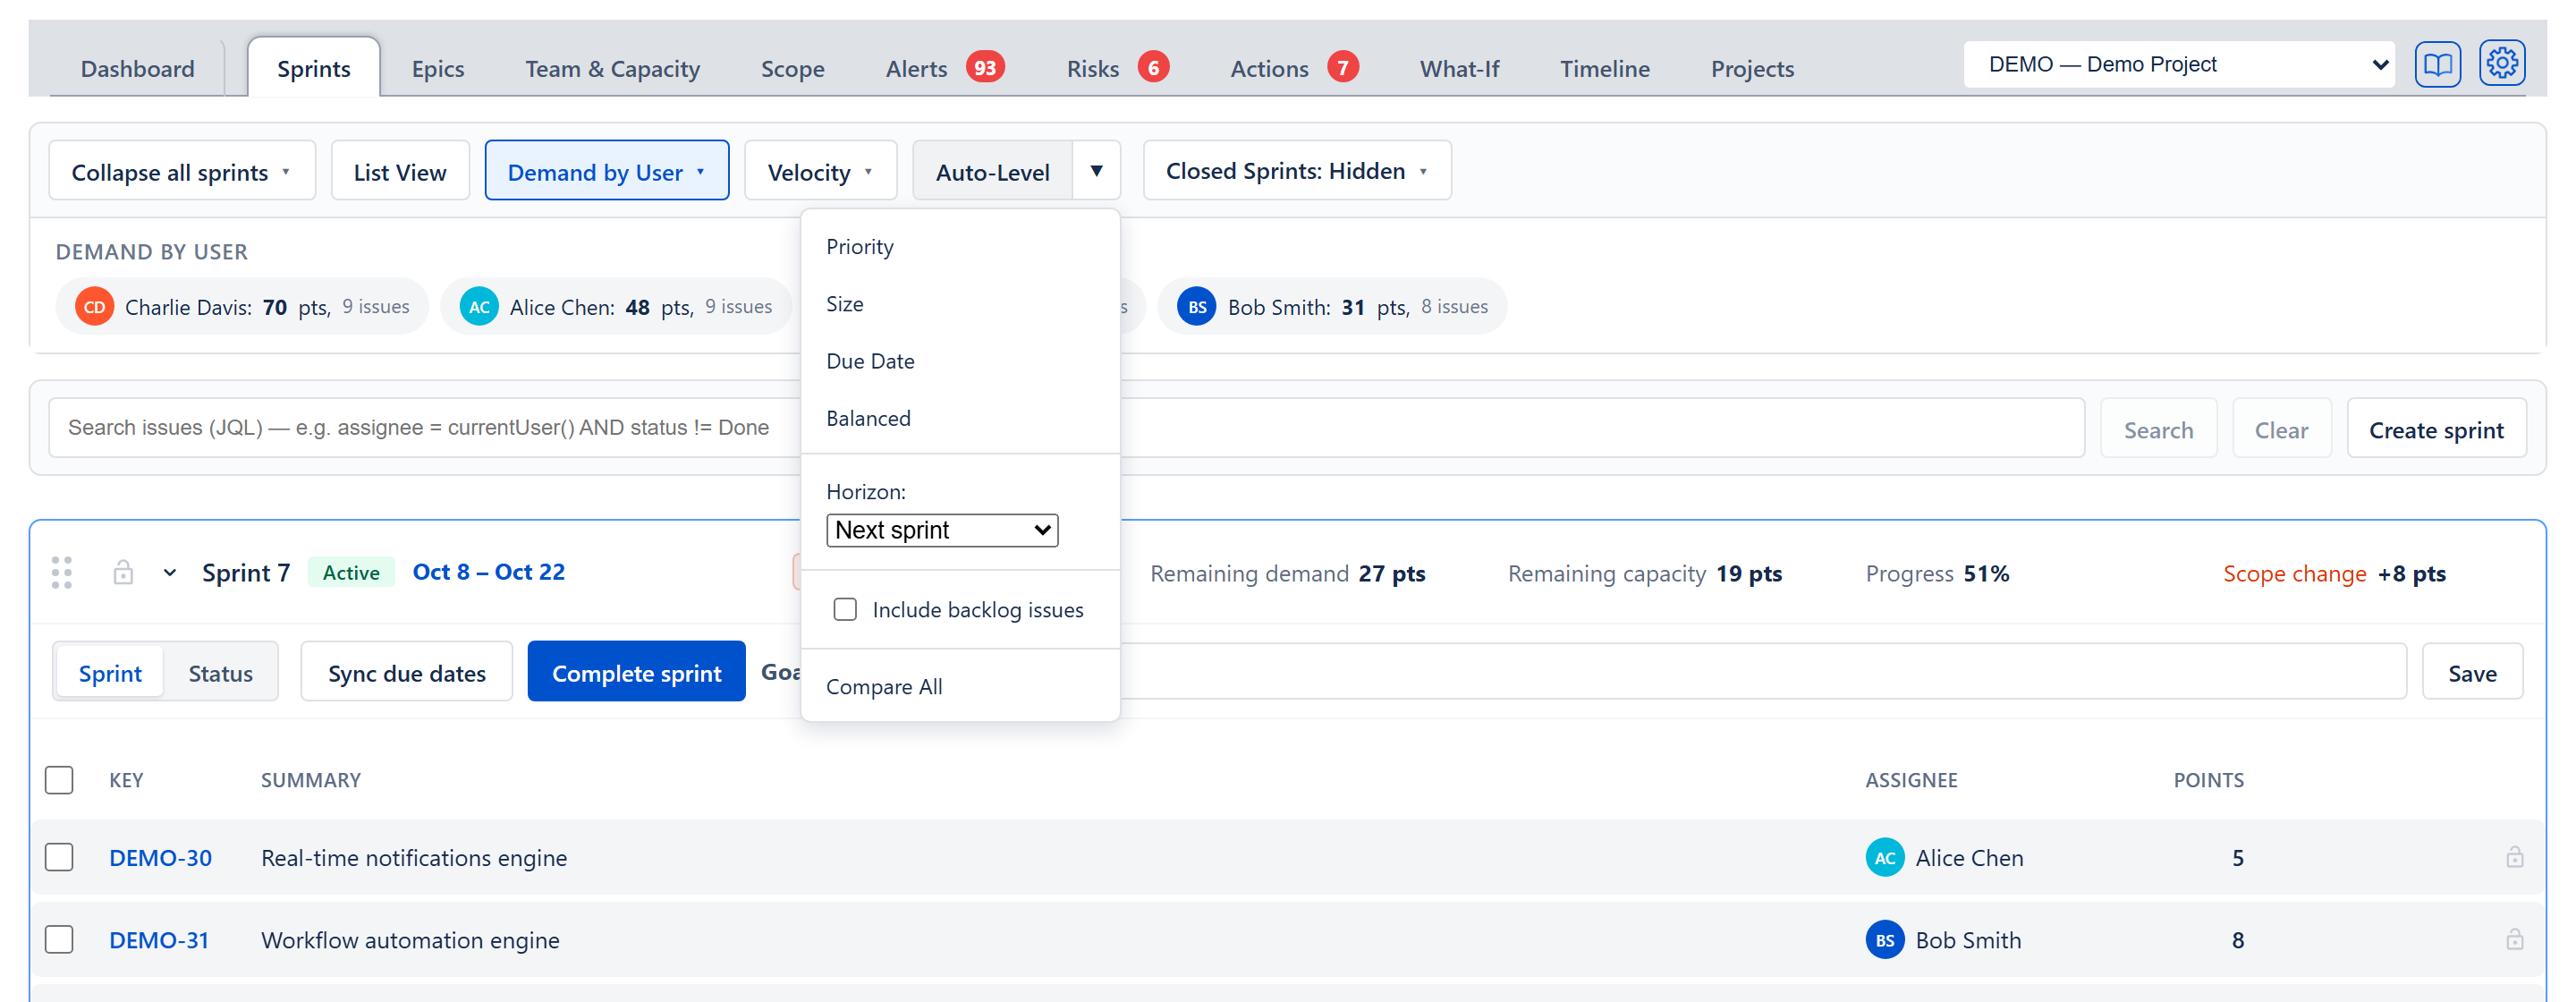
Both halves of the button — Auto-Level and the ▼ beside it — open the strategy menu. Choosing a strategy starts the rebalance:
- Priority — fills sprints front to back with highest-priority issues first.
- Size — fills sprints front to back with smallest issues first.
- Due Date — fills sprints front to back with soonest-due issues first.
- Balanced — places the largest issues first into the sprint where they fit best, balancing remaining room and workload.
The same menu also offers:
- Horizon — a dropdown limiting how far ahead Auto-Level rearranges: Next sprint (the default), Next 2 sprints, Next 3 sprints, or All sprints. It counts the sprints that are not closed, in list order. Sprints beyond the horizon are not touched.
- Include backlog issues — a checkbox that controls whether backlog work counts in the numbers — the Dashboard, Scope, What-If, the alerts, and the demand figures Auto-Level reads. Auto-Level never moves a backlog issue into a sprint: it rearranges only the work already in sprints, whether or not this is ticked. The Backlog card at the foot of this tab lists what is in the backlog whether or not this is ticked.
- Compare All — runs all four strategies at once and shows a side-by-side delivery forecast so the planner can pick the best plan.
- When there is no closed-sprint history and nobody on the Team & Capacity tab, an amber line at the top of the menu reads No velocity history and no team capacity — packing against Sprint Capacity (N pts a sprint, from Projects → Edit).
Selecting a strategy immediately runs a dry-run preview without touching Jira. While a preview is running the button reads Leveling... and afterwards carries the chosen strategy's name. Selecting a different strategy mid-session swaps the preview to the new arrangement.
Closed Sprints dropdown
A dropdown reading Closed Sprints: Hidden, with four explicit modes for showing historical sprints:
- Hidden — no closed sprints (the default; fastest).
- Last 5 — the five most-recent closed sprints, by end date.
- Last 20 — the twenty most-recent closed sprints.
- All — every closed sprint available.
Closed sprints render inline, interleaved chronologically with active and future sprints by start date (a closed sprint that ran in February sits above an active sprint that started in March, which sits above an April future sprint). A Closed sprints divider with the number of closed sprints shown sits above the first closed sprint in the list. The dropdown only caps how many of the most-recent closed sprints are shown; their position in the list comes from their dates.
Create sprint
A button on the search row, beside Create Issue, at the right. Neither is filled blue: they are available, not urged (Don, 2026-08-20). Hidden in read-only mode. Opens a dialog headed Create New Sprint that creates a new sprint on the configured board with Sprint Name (required), Start Date, End Date, and Goal, and a Create Sprint button.
A big board arrives in more than one call
A board with thousands of issues no longer fails to load. The app reads it in calls of up to 18 seconds each, draws the cards with what has arrived, and asks for the rest until the whole board is in. While that is happening a line above the cards reads Showing 2,400 of about 3,100 issues; the rest are still loading. (the second figure is Jira's own count for the project's Issue filter; without it the line reads Showing 2,400 issues so far; the rest are still loading.). The same line appears on the Dashboard, the Scope tab and the Trends tab. Only when a single page of issues cannot be read inside the limit does the line change, in red, to the message asking you to narrow the project's Issue filter on the Projects tab; the issues already read stay on the cards.
Auto-Level session
When Auto-Level is active, a panel opens beneath the toolbar:
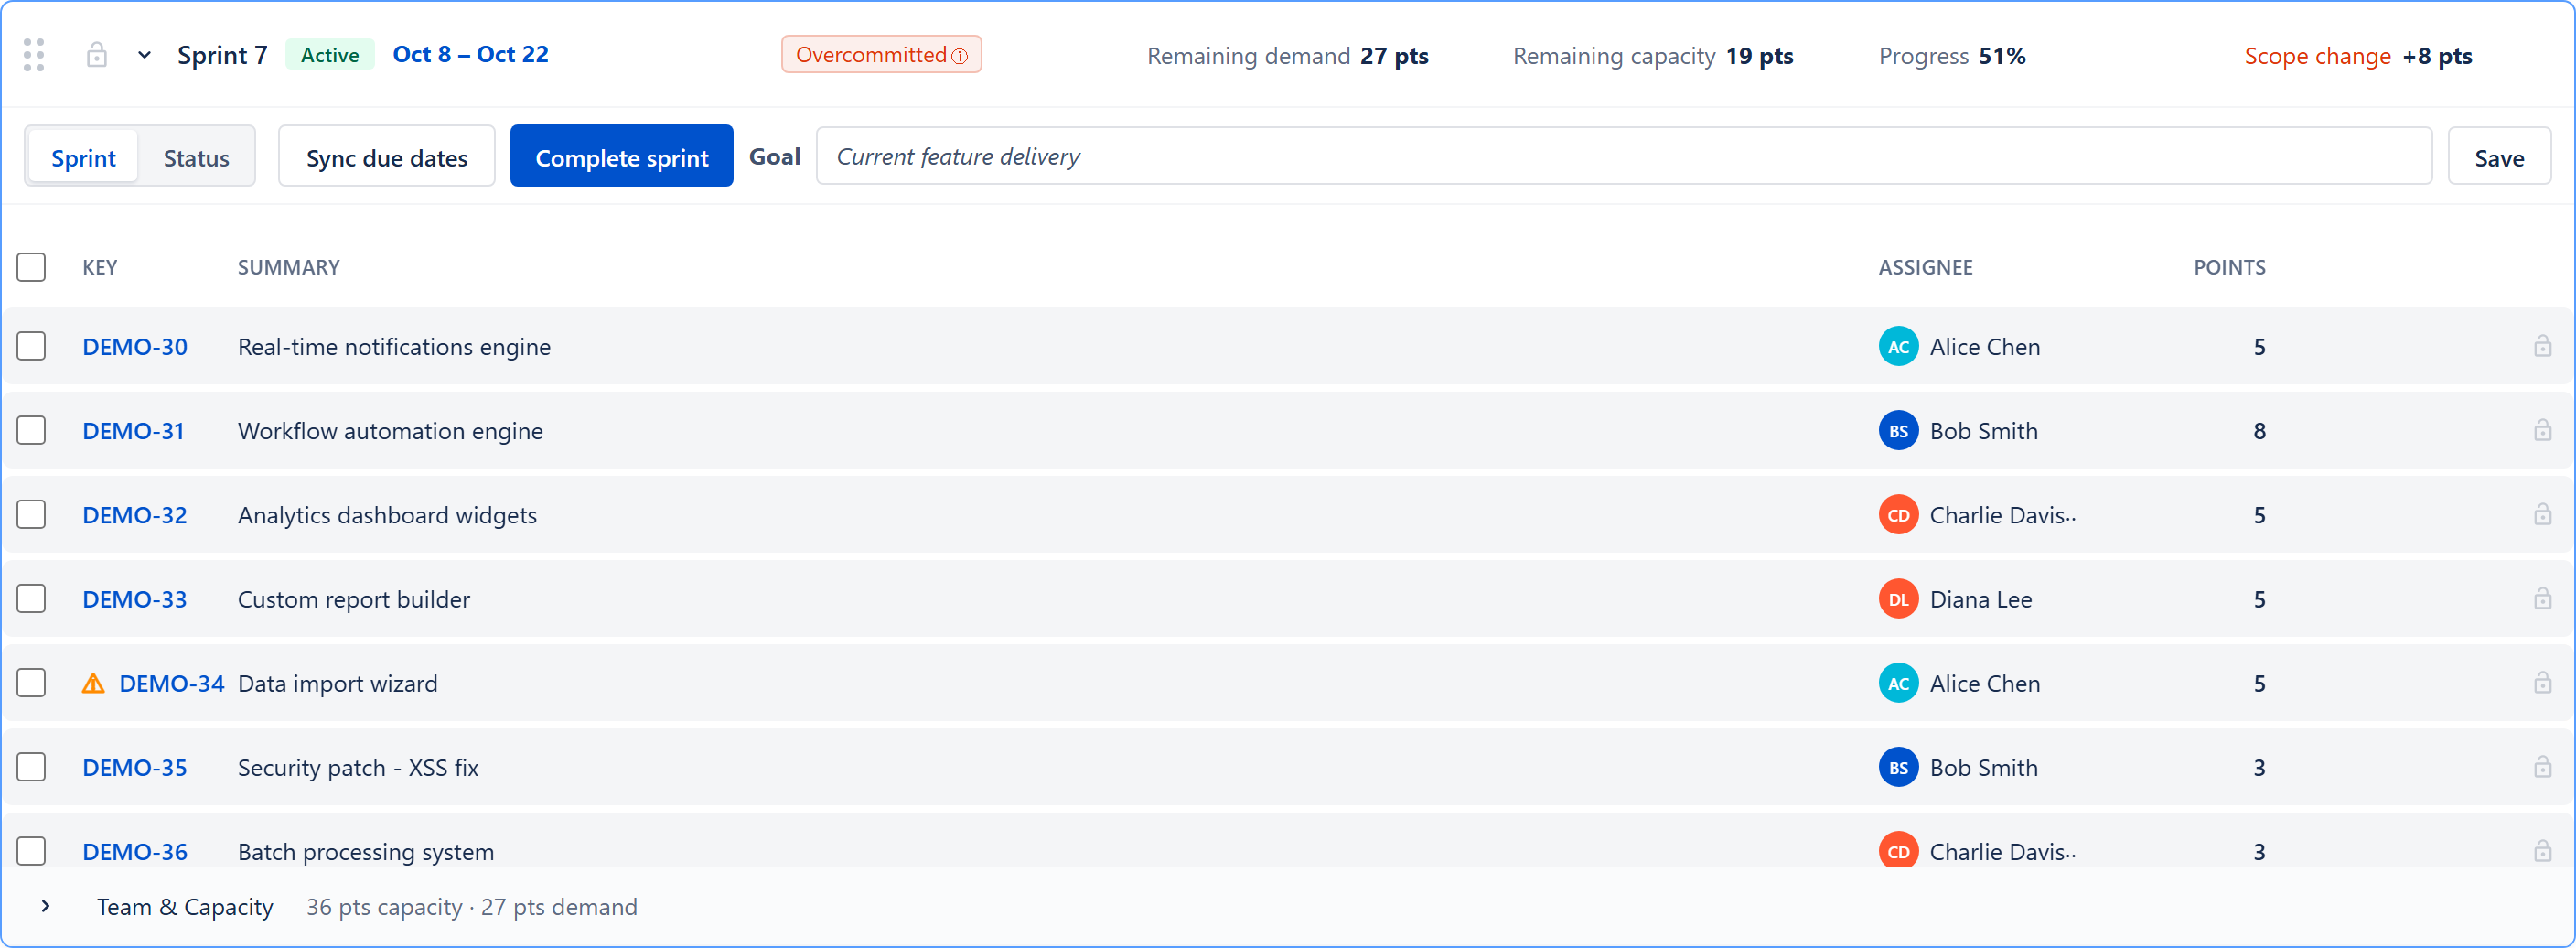
- A legend line — Auto-levelled, Manually moved, Locked — sits above the sprint cards. Each moved row carries a small ← Sprint N badge naming the sprint it came from, coloured by whether Auto-Level or the planner moved it; hovering it says why Auto-Level moved it where it can (for example capacity in Sprint 7 was full). Locked issues show a lock icon. Moved issues are sorted to the top of each sprint so they are easy to spot.
- A Deviations line noting either strategy could place every issue as preferred, or the number of placements constrained by capacity, dependency, due date, lock or horizon.
- An amber note when the run could not do everything: sprints beyond the horizon that stay over capacity (widen the horizon (Auto-Level ▾ → Horizon)), issues that fit a sprint but had no room within the horizon (see Unplaced Issues below), and issues larger than any whole sprint (see Oversized Issues below).
- Packing against Sprint Capacity (N pts a sprint) when there is no closed-sprint history and nobody on the Team & Capacity tab: Auto-Level packs against the project's Sprint Capacity number from Projects → Edit.
- A Forecast line — the projected on-time percentage (N% on-time) with P50 and P85 sprint estimates, the percentage coloured green, amber, or red.
- Skill Constraints — when team skills are configured, per-sprint counts of issues whose assignee lacks required skills. Hover lists the issues and missing skills.
- Action buttons — Undo changes (reverts to the original arrangement, stays in session), Accept (commits to Jira), and Exit (cancels the session entirely). There is no AI review of the plan: the ✨ AI Review button that once sat here was removed on 6 October 2026, when every question the app put to an AI model was taken out.
- Delivery Forecast comparison — appears when Compare All is on, showing all four strategies side by side.
- Placement dialog — appears at Accept time when Auto-Level left issues unplaced. It is headed Place Oversized Issues when every one is larger than any sprint, otherwise Place Unplaced Issues, and each issue says which of the two it is. Each issue gets its own destination dropdown — Backlog (recommended) or any sprint that is not closed — then Confirm & Save or Cancel.
During a session, drag-drops between rows are local previews only — they do not write to Jira until the planner clicks Accept. The same holds for a cell edited in the issue table during a session (points, a date, an assignee, a priority, a summary): the preview shows the new value at once, nothing is written, Accept writes the held edits after the moves (the notice then reads Saved: N issues moved in Jira, M edits written), and Exit drops them with the session. An edit Jira refuses at Accept stays on the preview and is named with Jira's reason, like a refused move.
Accept sends the moves to Jira one by one. When every move lands, the notice reads Saved: N issues moved in Jira and the session ends. When Jira refuses one or more of them, the session stays open: the moves Jira took are kept, the refused issues stay where the preview put them on the cards, and a red notice reads 2 of 3 moves saved. Jira refused IBTW-5: <Jira's reason>. The refused move is still on the cards: press Accept to try again, or move it by hand. The notice stays until the next action, and a second Accept sends only the moves Jira has not taken.
Sprint row
Every sprint, the backlog, and the virtual “Oversized Issues” row (when shown) renders as a sprint card with the same structure. When the board has no sprints and the backlog is empty, the tab shows No sprints found with No active or future sprints found for this board. beneath it instead.
Header (always visible)
- Drag handle (six dots, Drag to reorder) for moving a sprint up or down one place. The order is remembered.
- Sprint lock — pins every issue in this sprint during Auto-Level. Locked sprints also reject drops.
- Collapse/expand chevron — per-sprint open/closed state is remembered.
- Sprint name plus a state badge (Active, Future, or Closed).
- Clickable date range. Click to edit the start and end dates, with Save and Cancel; No dates set appears when missing. An end date before the start date is refused with End date must be after start date.
Header stats (not shown for the backlog; the oversized row shows a compact "N pts total · No capacity" line instead):
- Deliverability badge — Deliverable, Tight, or Overcommitted on active and future sprints: Deliverable when the capacity covers the demand, Tight when the capacity is at least 90% of the demand but short of it, Overcommitted below that. A sprint with neither a start nor an end date has no capacity to judge against, so its badge reads No dates in muted grey instead of a verdict (26 September 2026), with No sprint dates beside the capacity figure. A CLOSED sprint's badge says what happened instead (2026-09-02): Delivered, in muted grey-blue, only when everything it committed was finished; otherwise Delivered M of N (done of committed) in muted amber — colours distinct from the forward-looking trio, so a past sprint never reads as a live verdict. The badge is a direct demand-versus-capacity check, so it always matches the demand and capacity figures shown beside it — on first render, after a drag-drop, and after an Auto-Level session. For an active sprint it answers "does the remaining work fit the capacity left in this sprint?" — see the Remaining demand / Remaining capacity stats below. Forward-looking pre-mortem confidence is shown in the panel the badge opens instead (see below), not in this badge.
- Tapping the badge (future and active sprints) — opens a panel headed Confidence — <sprint name> with the confidence score, the risk factors and, when the sprint is at risk, a Trim List — Path to 90% Confidence of issues to defer. The badge carries a small information mark so it reads as something to tap rather than a label. On an active sprint (added 2026-09-02) it judges the rest of the sprint: the remaining demand against the capacity left, with velocity scaled to the part of the sprint still ahead, and the panel's figures read Remaining and Capacity left instead of Committed and Capacity; work in progress is not counted as carry-over mid-sprint. A closed sprint's badge is a plain label with no mark and no tap — nothing is ahead of it; Retro is its view. Until 2026-09-10 this was a separate Confidence button sitting beside the badge: two controls answering nearly the same question, and the second gave no clue it held the first one's detail. The column that button filled is still held open, so the figures beside it did not move.
- Demand — the work not yet done in the sprint, in points, hours, or days (done and cancelled issues are left out; in time projects each issue is sized by the project's Remaining Work setting). On an ACTIVE sprint the stat is labelled Remaining demand.
- Capacity — this sprint’s capacity, from whatever its Capacity source control is set to. On an ACTIVE sprint the stat is labelled Remaining capacity: the capacity in the part of the sprint still ahead of today. Where the sprint's capacity is the team's, that is what the people's typed weeks leave in the days still to come — so somebody with nothing typed for this week and a full week typed for next counts in full, which a share of the sprint's calendar time could not see (Don, 9 October 2026: "Use the exact answer... No guessing or estimating if there is actual data to use instead."). Where the sprint carries a flat number instead — the project's Sprint Capacity, or a number typed for this sprint alone — there are no weeks behind it to ask about, and the figure is that number times the share of the sprint's calendar days still to run, today counted in full (Don, 13 October 2026: "Whole days."). So the figure does not shrink as the hours of a day pass: a fourteen-day sprint of 36 pts shows 18 pts all through its eighth day. Until then this one case was worked out by the hour, and the Delivery Forecast card drifted through the day while this card did not. A sprint Jira still marks future whose dates have already passed is treated the same way and reads Remaining capacity 0 — it was never started and its days are gone (decision 2026-09-03) — so its badge judges its demand against nothing rather than against a full figure the days can no longer supply. Days already elapsed were spent on the work that is now done, so remaining work is judged against remaining time — a sprint can no longer read Deliverable on its last day just because its full-sprint capacity exceeds the open work. A sprint with neither a start nor an end date has no capacity at all — neither the project's Sprint Capacity nor the team's figures give it any (26 September 2026) — unless a number has been typed for that sprint alone, which is honoured; each active sprint (including parallel active sprints) is prorated by its own dates. The editable capacity value in the Team & Capacity section below stays the full configured figure — it is the setting, not the measurement. When there is no capacity, a short amber reason sits beside the figure (No sprint dates, Nobody on the Team & Capacity tab, or No capacity typed for the team).
- Progress (active sprints, and future sprints whose start date has passed) — the share of the sprint's committed work already done: the story points of finished issues as a share of all story points in the sprint. No screen offers another basis. It reads — when the sprint carries no story points.
- Load (future sprints) — demand as a share of the sprint's capacity, where 100% exactly fills it, shown in red above 100%. It comes from the same shared definition the deliverability badge beside it uses, so the two can never disagree. A future sprint has no burn-down to report, and Progress — told the reader nothing.
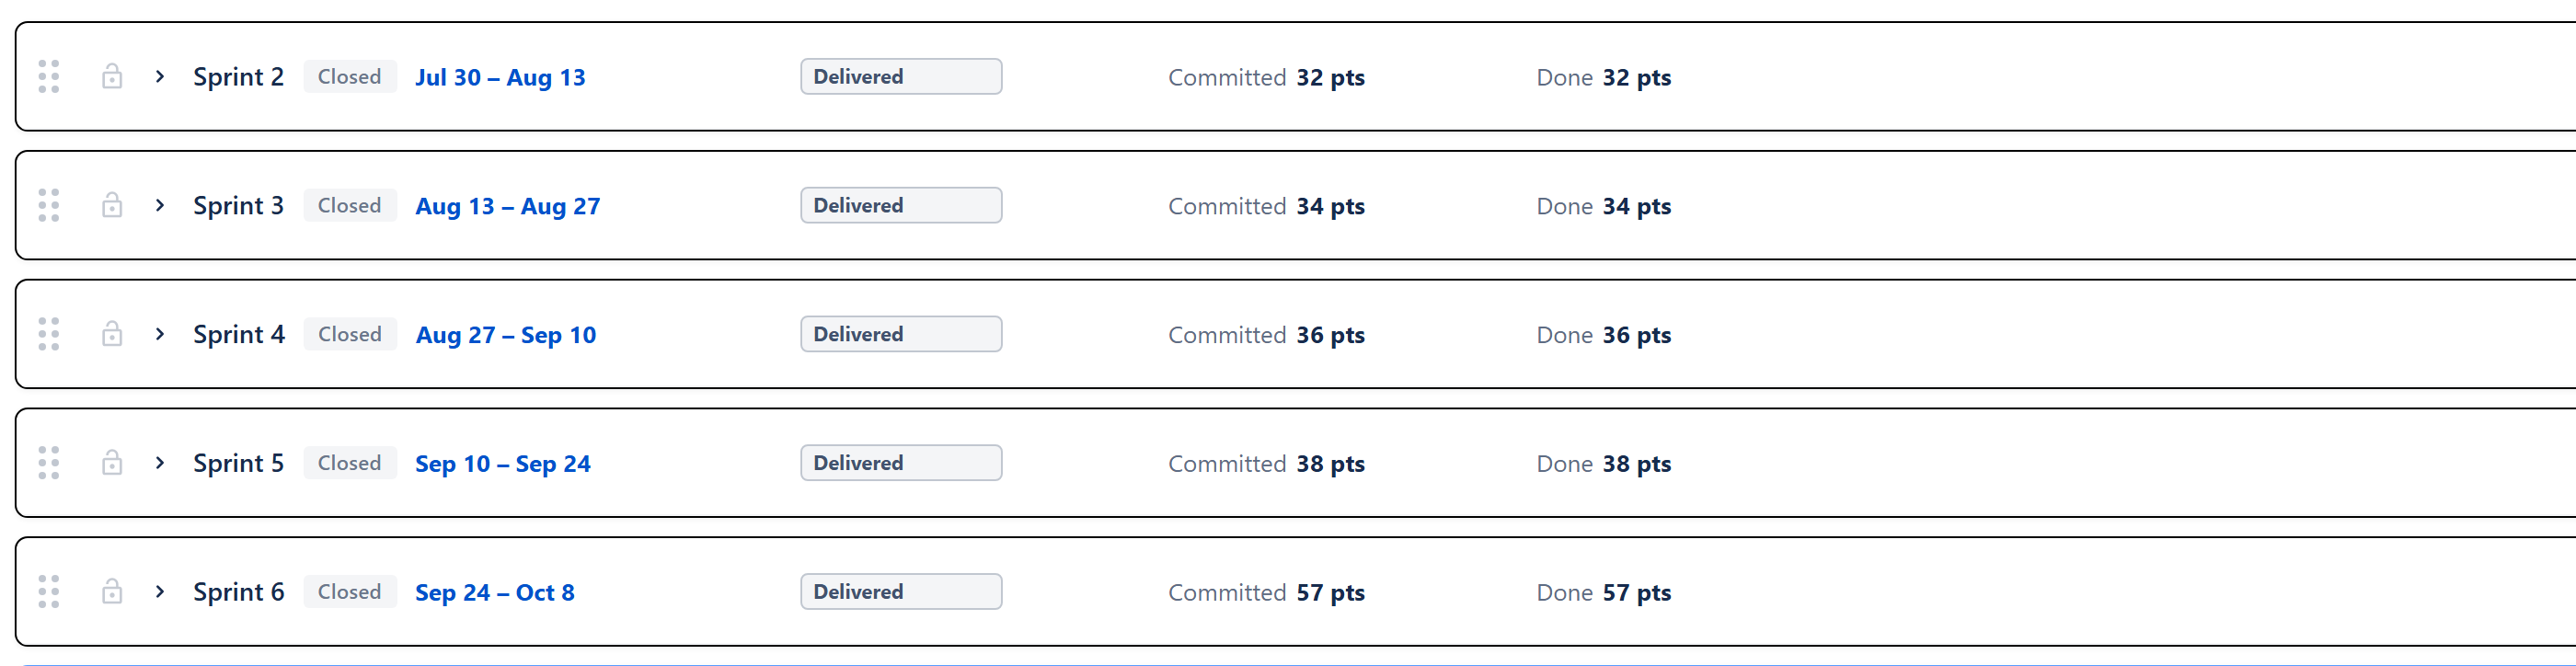
- Committed · Done (closed sprints) — a closed sprint's header carries these two figures in place of Demand, Capacity, Load and Scope change (2026-09-02): Committed is every issue at its full size (cancelled work excluded) and Done is what was finished, both summed from the same per-person Total Demand and Completed figures the Team & Capacity table below shows — each person's exact figure added up first and the total rounded once, so the header never drifts from the sprint's real size by each row's rounding (6 October 2026). The old header read Demand 0 pts · Capacity N · Load 0% on every closed sprint and looked like a fault. Work carried out of the sprint counts (26 September 2026): an issue that was in the sprint when it closed and now sits in a later sprint is listed on the closed sprint with the status Carried over and the sprint it went to, counted in Committed and never in Done, so a sprint that carried an 8-point issue forward reads Delivered 32 of 40, not Delivered. Jira's sprint field lists every sprint an issue was ever in; that is where the app reads it. Cancelled work is never carried.
- Scope change (active and future sprints) — scope ADDED since the sprint started, the same measure as the Status section's Scope Added: work pulled into the sprint after start, estimate increases, and issues created after start, read from each issue's Jira change history. Added work counts at its full committed size. When no change history is available it falls back to a start-of-sprint snapshot (demo data) or to issues created after start. Future sprints show — (nothing can be "added" before a sprint starts). Red when positive, green when negative. "After start" means after the moment Jira started the sprint, not after midnight of that day (26 September 2026): work created or pulled in earlier on the day the sprint started is not added work.
When the row is collapsed, the row beneath the header is hidden; the stats remain shown.
Actions row
Visible when the row is expanded; not shown on the backlog or the oversized row. Left to right:
- The Sprint and Status / Retro mode buttons (see below).
- Sync due dates (active and future sprints) — pushes the sprint's end date to every issue's due date. Disabled when the sprint has no issues or no dates. Reports the result inline, for example Updated 7 issues, 1 failed.
- Start sprint (future sprints that have dates) — asks first in a dialog headed Start Sprint: <name>; when another sprint is already active it warns that starting this one will leave multiple active sprints running at once. Not filled blue: starting a sprint is a choice, not the thing the screen is pushing you towards (Don, 2026-08-20).
- Complete sprint (active only) — opens the Complete-Sprint dialog when there are incomplete issues, open action items, or risks ready to close. Otherwise a simple confirm (This will close the sprint.).
- Delete Sprint (future only) — opens a destination picker if the sprint contains issues, otherwise a plain confirm (This cannot be undone.).
- + Create Issue — expands into a small form with an issue type dropdown (Story, Task, Bug, Sub-task), a summary box (Issue summary…), and Add or Cancel; the issue is created in this sprint. Hidden in read-only mode and in demo mode.
- Goal — the sprint goal, or Click to add goal. Click the goal text (or the Save button beside it) to edit it, then Save or Cancel. Because this row is shown in every mode, the goal stays visible in Sprint, Status, and Retro views.
Sync due dates, Start sprint, Complete sprint and Delete Sprint are hidden during an Auto-Level session.
Sprint and Status / Retro modes
Every non-backlog row has a two-button selector at the left of the actions row. The Sprint button shows the planning body. The second button is state-aware:
- Future sprint — labelled “Status”, shows the figures for any work already underway. The line beside the sprint's name reads Not started, and the notice above the sections says the sprint has not begun.
- Active sprint — labelled “Status”, shows what has happened so far. Nothing in the Status view is projected: there is no pace, no run rate and no projected finish. The line beside the sprint's name reads Active.
- Closed sprint — labelled “Retro”, opens the post-sprint retrospective. Closed rows default to this view; active and future rows default to Sprint.
Sprint mode body
Visible when the row is expanded and Sprint mode is selected. The issue table comes first; the Team & Capacity section follows it.
Issue table
- Columns follow the Display Columns list in the Settings gear. With nothing chosen, Key, Summary, Assignee and Points show. The list offers Remaining Est, Original Est, Time Spent, Status, Type, Priority, Start Date and Due Date, and also Reporter, Sprint, Labels, Parent, Epic, Sub-tasks and Linked issues. The points column is headed the same word everywhere it is named — the sprint card, List View, and the Settings gear's own Display Columns list: Points in a points project, Time (hrs) or Time (days) in a time project. That holds for a column chosen from the picker under Jira's own field name ("Story Points" on most sites) too. The gear's list used to read "Story Points" whatever the project was estimated in, so an hours project named the same column three different ways (2026-09-06).
- Click any column header to sort ascending, again for descending, again to clear.
- Bulk select via header and per-row checkboxes. Selecting one or more issues opens a sticky dark bar at the top with: N issues selected, Move to backlog, Set priority (Highest, High, Medium, Low, Lowest), and Clear.
- Drag any row to another sprint to move it, a Done row like any other (2026-09-05); only a row locked for Auto-Level stays put. If the dragged row is part of a multi-select, the whole selection moves together. Drop on another row in the same sprint to reorder — the dragged row lands just above or just below the row it is dropped on, whichever the line drawn on that row while dragging shows, and a dragged selection lands there together, in its own order: the new order is kept by the app and also written to Jira's own ranking, so the Jira board shows it too (if Jira refuses, a notice says The order was not written to Jira with the reason). Drop on the backlog area to move to backlog. While a row is being dragged, a strip appears under the sprints reading "Drop here to move to <the next sprint>", and under the last sprint "Drop here to move to the Backlog", so the bottom row of a sprint has a target right beneath it instead of a card's length away (2026-09-05); no strip is drawn when its target is the sprint the row came from or a locked sprint. Locked issues are filtered out of any drop. Auto-scroll kicks in near the top and bottom of the viewport during a drag. A row let go over nothing — outside every card and strip — moves nothing, and since 26 September 2026 the tab says so, in the same red line a refused move gets: Nothing moved: the drop did not land on a sprint or the backlog. Drag the issue onto a sprint card, or onto the "Drop here" strip under a card. When Jira refuses a move, the issue goes back where it was and the same red line above the cards gives Jira's own reason, or Jira would not move that issue. It has been put back. when Jira gave none; its × clears it. Epics are never listed in a sprint's issue table, whatever the sprint field on the epic says (Don's ruling of 23 September 2026): they live on the Epics tab, and a sprint's counts and totals leave them out.
- The issue key is a link to the issue in Jira (2026-09-05).
- A sprint with no issues shows No issues in this sprint yet — drag issues onto this card, or use + Create Issue above.
Inline cell editing
Editable cells show a pointer or text cursor on hover and a Click to … tooltip. There is no dashed underline: a dotted line under every editable value read as clutter (Don, 2026-08-23). The points and original-estimate cells have a minimum width so cells that display 0, -, or an empty value are still easy to hit. In read-only mode the cells stop offering an edit at all, rather than opening an input and then refusing the save.
- Key — opens the issue in Jira. A warning icon appears when the issue is blocked by something in a later sprint; hovering it names the blocker and its sprint.
- Summary — click to edit text. Enter or clicking away saves; Escape cancels.
- Assignee — click (Click to reassign) to open a dropdown of the active team members on the Team & Capacity tab plus Unassigned. Offered only when that tab has active members. The dropdown floats above the table so it is never clipped by row or table overflow. Optimistic update with rollback on error.
- Story points — click to edit (points projects only).
- Original Estimate — click to edit, in the project's time unit.
- Status — click to open a transition list fetched live from Jira (Loading… while it arrives); No transitions available when none apply.
- Priority — click to choose from the five-level palette with coloured dots.
- Start date and Due date — click to open a date picker; past-due dates are highlighted on issues that are not done.
- Time Spent and Remaining Est are read-only, and read as the same words every other screen uses: 14 hrs, or 2 days in a project measured in days. Until 2026-09-10 these two cells alone wrote 14h and 2d, so the sprint card and the List View beside it spelled the same value two ways.
- A warning icon appears when an issue is larger than the sprint’s capacity — in the points cell in a points project, in the Remaining Est cell in a time project.
- A per-row lock button keeps that issue in place during Auto-Level.
Team & Capacity (collapsible, closed when the row opens)
The section sits below the issue table and starts closed (Don, 2026-08-20), showing one line: Team & Capacity with N pts capacity · M pts demand. Its own arrow opens it.
- Full capacity row — labelled Full capacity: shows this sprint's capacity. Click the value to type a number for this sprint alone (✓ saves, ✕ cancels). On an active sprint a read-only Remaining capacity figure sits at the end of the row — the capacity in the part of the sprint still ahead, the same number the header stats and badge use. Beside the figure, a control labelled Capacity source: with three choices:
- Sprint Capacity — the project's number from the Projects → Edit form, or a number typed for this sprint by clicking the figure. (Until 2026-09-01 these were two separate choices, Project default and Custom, which were the same thing.)
- Team capacity — everyone marked active on the Team & Capacity tab who has a share of this project, added up. A number typed for one person in the table below replaces what that tab works out for them, and moves this sprint's figure and its badge with it.
- Effective team capacity (N%) — the same sum multiplied by historical efficiency, which is finished work divided by committed work averaged over closed sprints. The row shows the sum it came from, for example (40 × 85%). The option is listed when a closed sprint gives a usable reading, or when it is already selected. With no usable reading nothing is discounted (since 17 September 2026): the option and the row read (100%, not measured), and the figure equals Team capacity until sprints close.
Changing the Capacity source clears any number typed for that sprint. When there is no capacity to show, a line beside the figure says which of three things is missing and where to fix it: the sprint has no start and end date, nobody has been added on the Team & Capacity tab, or the people there have no capacity typed. A capacity of zero somebody typed on purpose is a real answer and says nothing. The header row carries the same in a few words. On Sprint Capacity, when the people below add up to a different number, the row also says (people add up to N pts), so the two figures are never confused. On Team capacity and Effective team capacity, nobody entered on the Team & Capacity tab means the sprint reads zero — the project's number is never substituted. When people are set up on the Team & Capacity tab but none has a share of this project, an amber notice says so and points to the Team Allocation Matrix on the Projects tab.
- Per-member table — one row per assignee with MEMBER, TOTAL DEMAND (everything assigned to the person in this sprint at full size, finished work included), COMPLETED, CAPACITY, and STATUS. The Capacity cell is that person's own capacity — the number typed for them here if there is one, else what the Team & Capacity tab works out for them. It is never a share of the sprint's own number, which is what it was on some sources until 2026-09-01. On an ACTIVE sprint the capacity pair is FULL CAPACITY (editable) and REMAINING CAPACITY (read-only — that person's own capacity in the days of the sprint still ahead, from their typed weeks); future sprints show the single CAPACITY column.
- Click a row to filter the issue table to just that user; click again, or the Show all button in the MEMBER heading, to clear.
- A small “N blocked” badge appears when an assignee has unfinished work blocked by another issue.
- Capacity is an editable number box: the number is that person's capacity for that sprint, and it is written to their weekly values on the Team & Capacity tab — the same place that tab's Sprint period sets. A × beside a number set this way, or a right-click on the cell, clears it, putting the person back on whatever they had before. Since both screens write there, a number set on either shows on the other, and on Team capacity it moves the sprint's own figure and its badge.
- Status badge per member uses the shared load bands: OVERCOMMITTED (above 115% of capacity), OPTIMAL (90–115%), AVAILABLE (60–90%), UNDERLOADED (below 60%) — the same bands as the Team & Capacity tab. The band compares the member's remaining work against their capacity; on an ACTIVE sprint that capacity is the part of the sprint still ahead (same rule as the header's Remaining capacity), while the editable Capacity cell still shows the full per-sprint value.
Status and Retro mode body
Visible when the row is expanded and the second mode button is selected — Status on a future or active sprint (what has happened so far) or Retro on a closed sprint (the final review). The header line reads Sprint Status or Sprint Retro, names the sprint beside it with Not started, Active or Completed, and carries the Export button, which copies the review — title, summary, the metrics table and the action items with their owners and tick state — to the clipboard as text ready to paste into a retro write-up; it reads Copied! once the copy has worked. There is no separate sprint dropdown — the row you expanded is the sprint. On a future or active sprint the three sections that only make sense once the sprint closes — Team Health Pulse, Insights and Talking Points — are held back behind a padlock reading Unlocks when the sprint closes, and the notice above the sections names them.
This view reads the same sprint and velocity data the rest of the app uses, so its numbers match the sprint stats above and the Dashboard. It turns a sprint into a structured review for the scrum master or team lead: what was committed versus delivered, what slipped, the patterns behind it, and a set of follow-up actions.
The sections appear in this order, each folding open and closed from its heading: Sprint Summary, Delivery Metrics, Team Health Pulse, Patterns, Insights, Talking Points, Team Contribution, Action Items. Sprint Summary and Delivery Metrics start open; the rest start closed.
One size for an issue, in this whole view. Delivery Metrics, Team Contribution, Team Health Pulse and the Flag button all size an issue the same way: an unfinished issue by the project's Remaining Work setting in the Projects tab's Add / Edit Project form (Committed size by default, or Live estimate), a finished issue always at its committed size. The real values are added up and rounded once, where the figure is shown, to one decimal — so four half-hour tasks read 2 hrs in every section and a twenty-minute task reads 0.3 hrs rather than vanishing or being called unestimated. Only an issue with no estimate at all is an estimation gap.
Sprint Summary
A plain-language recap: how much was delivered of what was planned and the completion rate, how many issues and points carried over, and how many were added mid-sprint. On a closed sprint it ends with a one-line verdict (for example Overall, the sprint was successful. at 85% or more). It is the one-paragraph “what happened.”
Delivery Metrics
The same figures as a table — Planned, Delivered, Carry-over, Scope Added, and Completion Rate — with an average column alongside, so the sprint reads against its recent baseline. In the Status view three rows are renamed for a sprint that has not finished: Completed so far, Remaining and Completion so far.
The average is the three sprints that closed before the one you opened, in date order — never the sprint itself, and never a sprint that came after it. Every closed sprint the board holds is history (26 September 2026): the sprints the app closed itself, whose figures it captured at the time, and every other closed sprint read from Jira, counted the same way as the header's Committed and Done (work carried out of a sprint is planned there, not delivered there). Until then the average knew only the sprints the app had closed, so a project closed in Jira compared against nothing. Where fewer than three closed before it, the column heading names how many it used (2-Sprint Avg, 1-Sprint Avg); where none did, it reads No history and its cells show a dash. Only Planned and Delivered have an average; the other three rows show a dash. The Trend column compares the sprint with that average. Delivering more than the average is shown in green and less in red; planning more than the average is shown in the warning colour, because planning more than usual is what this product exists to warn about.
Note the deliberate difference from the header: Planned counts every issue in the sprint including finished ones (the committed size), while the header's Demand counts only unfinished work (what still needs capacity) — the two answer different questions and are not meant to match. When a closed sprint still has unfinished work and a sprint that is not closed exists, a 📌 Flag N issues for [next sprint] button appears here, with Surfaces in [next sprint]'s Risk analysis beside it; clicking it surfaces those carry-over issues in that sprint's Confidence panel, each recorded at its size in the project's own unit.
Team Health Pulse
An overall health percentage plus three scored dimensions — Commitment vs Delivery, Scope Stability, and Estimation Quality — a quick read on how the sprint went beyond the raw totals. Shown on a closed sprint's Retro only: on the Status view it is held back behind the padlock like Insights and Talking Points, because Commitment vs Delivery is the completion rate plus ten, which would score a sprint nobody has worked on yet as a failure. The same figure, sized the same way, is what the Risks tab's Suggested by the app list reads when it offers a team health declining risk.
Patterns
Observations the app raises automatically from the data, each with a short, specific note and the issue keys behind it: Carry-over (closed sprints), Mid-sprint Scope Growth, Estimation Gaps, Below Target Completion (a closed sprint under 80%), and Clean Sprint (a closed sprint with no carry-over, no additions and 80% or more completion).
Insights
Cards drawn from the metrics — Root Cause (a completion rate under 85% suggesting over-commitment), Pattern (two or more mid-sprint additions, suggesting a buffer), Positive (delivered more than 10% above the average, shown only once there is an average to be above), and a Recommendation card suggesting the next sprint's commitment: 95% of the average delivered over the sprints that closed before this one, worded on screen as (95% of your recent average velocity — a small buffer for reliability). When no sprint has closed yet, the Recommendation names the project's Sprint Capacity from the Projects tab's Edit Project form as the figure to plan against and says that is why; when that is not set either, it says what to set.
The Insights are worked out from the sprint's own figures — the completion rate, mid-sprint additions, the recent average, the project's Sprint Capacity — so they are the same every time and need no AI. Until 18 September 2026 an AI Insights button here sent those metrics to an AI provider and printed the paragraph it wrote back, with a follow-up chat beneath it. Don had both removed: their wording and their numbers were the model's.
Talking Points
Numbered discussion prompts for the retro meeting, drawn from the sprint's specifics. Locked on the Status view, since they only make sense once the sprint has closed.
Team Contribution
Headed Not a leaderboard: a per-member breakdown of completed against committed work for each active person on the Team & Capacity tab who has work in the sprint, with a % blocked flag at 20% or more, trend arrows for people with three or more sprints of history, and an Anonymize checkbox for sharing the retro outside the team.
Action Items
A register of follow-up actions, each with an owner and a done or open status. Add an item (Action item... and Owner boxes, then Add), tick it done, or delete it with ✕. The heading shows N of M complete. Action items persist with the sprint and also appear, globally, on the Actions tab. (Carrying unfinished work into the next sprint is done from the Delivery Metrics section's Flag … issues button, not here.)
Complete-Sprint dialog
Opens when an active sprint is being completed and there are incomplete issues, open action items, or risks whose mitigation is fully done. Headed Complete Sprint: <name>. Sections shown as needed:
- Incomplete issues — Move to Backlog (the default), Move to Sprint: with a dropdown of the other sprints on the list (each shown with its current total), or Create new sprint (named Sprint N).
- Risks — one Mark closed: <risk title> checkbox per open risk whose mitigation actions are all complete, unticked to start; tick to close it on confirm. Risks whose response is to accept them are never offered.
- Open action items — per-item choice of three: Roll over to a chosen sprint that is not closed (the default, set to the first such sprint), Mark done, or Leave on <this sprint>. A Roll all over: dropdown with an Apply to all button appears when there is more than one item.
Complete Sprint carries out the action-item choices, the risk closures, the issue moves (or sprint creation and move), and finally completes the sprint. The view refreshes on success.
Delete-Sprint dialog
Future sprints with issues open a dialog headed Delete Sprint: <name> with a destination — Move to Backlog or Move to Sprint: another sprint. Delete Sprint moves the issues, then deletes the sprint. Future sprints with no issues just show a plain confirm.
JQL Search
Above the sprint list. The planner can type a JQL query in the box (Search issues (JQL) — e.g. assignee = currentUser() AND status != Done) and press Enter or click Search. Results appear in a panel headed N results with a Collapse link, as a table of key (a link), summary, assignee, size, and status, capped at fifty rows. No issues match the query. when nothing matches; once collapsed, Show N search results opens the panel again. Clear resets the search.
A Create Issue button sits at the right end of the row, after Create sprint (hidden in read-only mode and in demo mode). It opens a panel headed Create issue with a Project dropdown, an Issue type dropdown (Story, Task, Bug, Epic), a Summary box, and Create or Cancel. The issue is created in the backlog, and the panel confirms with Created <key> in the backlog. or shows the error.
Backlog row
Sits below the sprints. Same card structure but with no header stats, no actions row, no mode selector, and no Team & Capacity section — the header reads Backlog with the issue count beside it ("8 issues"), then the issue table, with a + Create Issue button at its foot (hidden in read-only mode and in demo mode). It always lists every issue in the backlog, whether or not Include backlog is ticked — that checkbox only decides whether backlog work counts in the numbers. When empty, the backlog shows a drop area reading Backlog and Drop issues here to move to backlog, so issues can still be dragged in.
Oversized Issues row
A virtual row that appears at the bottom of the sprint list during Auto-Level when Auto-Level could not place one or more issues. It is named Oversized Issues when every one is larger than any sprint's capacity, otherwise Unplaced Issues, and its badge gives the issue count. Capacity controls and drops onto it are disabled. A banner explains the problem, says that Backlog is recommended, and — for unplaced issues — suggests widening the horizon under Auto-Level ▾. The planner picks a destination for each issue at Accept time.
Cross-cutting modes and settings
- Estimation mode — Story Points or Time, set in the Projects tab's Add / Edit Project form. Time mode swaps points for hours or days everywhere in the tab.
- Time unit — Hours or Days. Drives the displayed unit and the conversion of estimates.
- Capacity source — each sprint can be set to Sprint Capacity (the project's number or one typed for that sprint), Team capacity, or Effective team capacity.
- Sprint and issue order — manual reordering of sprints and of issues inside a sprint is remembered; the order of issues inside a sprint is also written to Jira's own ranking.
- Read-only mode — the Read-only Mode checkbox in the Settings gear. It hides Create sprint, both Create Issue buttons and the per-issue lock buttons, stops issue rows being dragged, and stops the issue table's cells offering an edit at all (so Set priority leaves the selection bar). The buttons that remain and would write to Jira — Start sprint, Complete sprint, Delete Sprint, Sync due dates, the sprint dates and goal, and Move to backlog — show Read-only mode — Jira data is not modified instead. Auto-Level still runs, but Accept shows Read-only mode — use Auto-Level preview only, changes won't be saved to Jira.
- Program view — the Sprints tab is replaced by a notice asking the user to pick a single project.
- Locks — per-issue and per-sprint locks are honoured by Auto-Level (locked things never move) and by drag-and-drop (locked rows can’t be dragged; locked sprints reject drops).
How the numbers are computed
- Auto-Level — takes the sprints that are not closed, up to the Horizon, applies the chosen strategy to order issues, places each one into the first sprint where it fits, and never exceeds capacity. The ACTIVE sprint's capacity is its remaining capacity — the capacity in the days still ahead, the same figure the header stat shows — so mid-sprint the engine moves out what genuinely no longer fits. The figure is worked out in the browser, where the team's typed weeks are, and sent to the engine that makes the moves, so the preview and the moves cannot come from two different readings. Only when the Horizon is All sprints can overflow spill into proposed new sprints, up to ten. Issues it cannot place become the Oversized or Unplaced Issues row. Locked issues stay put; locked sprints are skipped.
- Effective team capacity — team capacity multiplied by the team’s historical efficiency — finished work divided by committed work, averaged over closed sprints. When no closed sprint gives a usable reading, nothing is discounted (100%) and the row marks it not measured.
- Calculated capacity per sprint — comes from the Team & Capacity tab and contributes total points, total hours or days, and per-member capacities.
- Sprint confidence — a Monte Carlo simulation over velocity history, with adjustments for unestimated, large, and blocked items, on future and active sprints (an active sprint on the part still ahead of it). Mapped through three confidence bands and surfaced in the panel the header's deliverability badge opens (it does not drive the badge's own word, which is demand against capacity).
- Save — compares the staged plan with the original baseline, computes the net moves, and sends them to Jira along with any newly proposed sprints. Backlog moves are sent separately.
Effects on other parts of the app
- Demand by User: selecting a person narrows the sprint cards and backlog on this tab only.
- Velocity Lookback: the project's setting, so changing it here changes it for every tab.
- Include backlog: affects Auto-Level and every other view that counts the backlog in its numbers. The Backlog card on this tab always lists the backlog regardless.
- Closing risks from the Complete-Sprint dialog updates the global risk register.
- Action-item rollovers append the source sprint id to the action item so the destination shows the rollover provenance.
- Date sync writes individual issue due dates and triggers a refresh once finished.
- Reordering issues inside a sprint changes their order on the Jira board.